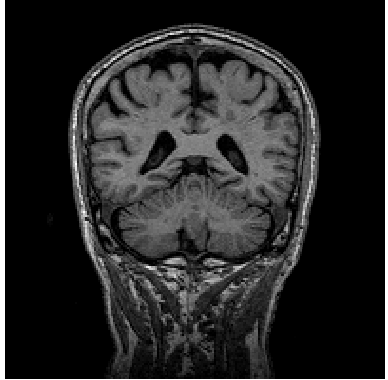
RAW, PRE- AND POST-PROCESSED IMAGE FILES, fMRI AND DTI
The collection of these images is central to meeting ADNI’s objective of developing biomarkers to track both the progression of Alzheimer’s disease and changes in the underlying pathology.
The table below represents an overview of the MRI data collected throughout the ADNI study.

Since its launch in 2004, the overarching aim of the ADNI study has been realized in informing the design of therapeutic trials in AD. ADNI3 continues the previously funded ADNI1, ADNI-GO, and ADNI2 studies that have combined public/private collaborations between academia and industry to determine the relationships between the clinical, cognitive, imaging, genetic and biochemical biomarker characteristics of the entire spectrum of sporadic late onset Alzheimer’s disease (AD).
Our strategy is based on the concept that AD can be characterized by the accumulation of A? and phosphorylated tau, synaptic loss and neurodegeneration, leading to cognitive decline. Clinical/cognitive measures lack both sensitivity and specificity to detect AD pathology. Instead, biomarkers are more reliably used to identify participants at risk for cognitive decline and to measure disease progression. This project will collect MRI (structural, diffusion weighted imaging, perfusion, and resting state sequences); amyloid PET using florbetapir F18 (florbetapir) or florbetaben F18 (florbetaben); 18F-FDG-PET (FDG-PET); CSF for A?, tau, phosphorylated tau (AKA phosphotau), and other proteins; AV-1451 PET; and genetic and autopsy data to determine the relationship of these biomarkers to baseline clinical status and cognitive decline.
The data types and responsible PIs are listed below. These numeric data types are provided for each MR exam in ADNI 3. For full details see the ADNI 3 MRI User Manual on either the Documents page or the ADNI 3 page. Details about each associated PI can be found on the Methods and Tools page.
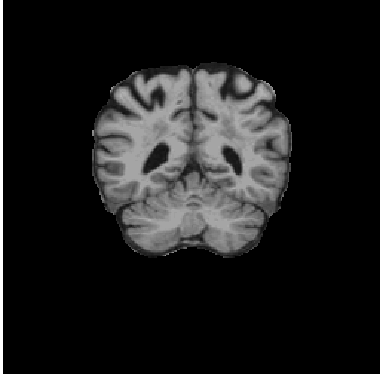
Four ADNI MR labs are funded to analyze 3D T1 scans: Paul Thompson (USC), tensor based morphometry; Nick Fox (UCL), boundary shift integral; Dugyu Tosun (UCSF), freesurfer; Mathew Senjem (Mayo Clinic), Tensor based morphometry symmetric normalization (TBM-SyN).
Charles DeCarli (UCD) – cerebro vascular disease metrics: white matter hyperintensity volume and brain infarctions
See GRE in the Image Data Archive
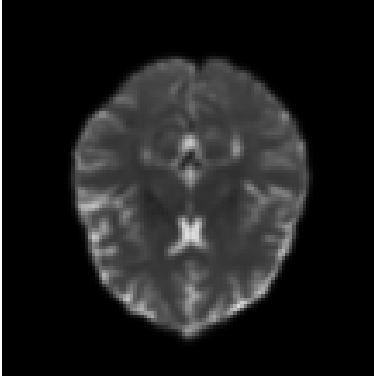
Paul Thompson (USC) and Charles DeCarli (UCD) provide analyses of regional fractional anisotropy, diffusivity and more advanced metrics from diffusion weighted imaging (DWI). After visual inspection and automated brain extraction (skull-stripping), all raw DWI are corrected for motion, eddy-current and echo-planar imaging (EPI) induced susceptibility artifacts. A single diffusion tensor (DTI) is fitted to corrected DWI scans with FSLs dtifit; scalar fractional anisotropy (FA) and mean, radial and axial diffusivity (MD, RD, AD) maps are obtained from the resulting tensor eigenvalues. These corrected DWI and scalar maps are also made available for download. The FA image from the JHU DTI atlas (Mori et al., 2008) is warped to each subject and the deformation applied to the stereotaxic JHU Eve white matter (WM) atlas labels. For each subject, the average FA, MD, RD, and AD are subsequently extracted from 57 WM regions of interest (ROIs) and are made available for download. For a complete list of ROIs and pre-processing steps please refer to Nir et al. (2013) or the ADNI website. As ADNI3 collects multi-shell and higher angular resolution DWI, we are currently also evaluating beyond-tensor diffusion metrics for monitoring brain aging, such as TDF-FA and related metrics (Nir et al., Magn. Res. Med., 2017).
Jeff Gunter and David Jones (Mayo) provide a summary connectivity metric for all scans
Dugyu Tosun provides regional perfusion measures
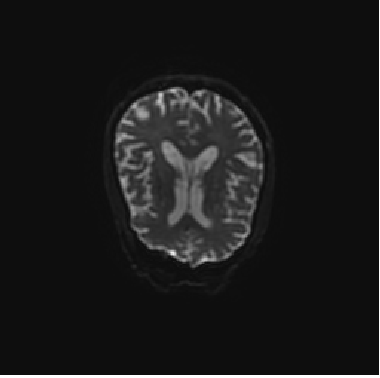
Paul Yushkevich and Sandy Das (UPenn) provide volumetric measurements of hippocampal subfields and extra-hippocampal medial temporal cortex subregions. These measurements are generated by applying ASHS software (https://sites.google.com/site/hipposubfields/ ) to the hippocampal T2-weighted MRI scan. If you are going to use these for analysis, here are the things to keep in mind:
- Take note of the QA columns, which describe image quality on a scale from 0 (worst) to 4 (best). These represent overall usability of the T2-weigthed images and we dont recommend using volumetric data for any image with a QA rating <= 1. Common factors contributing to low QA score are motion artifacts and slab orientation and positioning errors.
- For extrahippocampal cortical regions ERC, PHC, BA35 and BA36, use a normalized volume which can be obtained by dividing the raw volumes by the number of slices in which the ROI appears. This is because the segmentation of these regions along the MRI slice direction is partial. See Yushkevich et al. (PMID: 25181316) for additional details.
- CA2 and CA3 measurements are noisy due to the small size of these subfields. We recommend using CA1, or a combined CA (1+2+3) in your analysis if you can.
If you are going to be generating the segmentation yourself using the ASHS software, here are the things to keep in mind:
- Make sure to use an appropriate atlas. For ADNI data, you should use the 3T Penn Memory Center atlas.
- The manual segmentation protocol fully labels a certain number of coronal slices. However, the variability of the slice orientation across subjects may result in the automatic segmentation having straddler voxels labeled as one of the cortical regions at the anterior/posterior-most slices. You may want to disregard these voxels when estimating volumes. A heuristic we use is to discard all extrahippocampal voxels in a slice when the number of such voxels is below 25% of the median across slices.

Click here to download the PDF. Note that not all subjects will have every type of image data, depending on the study and acquisition site.
The 3T MRI imaging protocol for ADNI GO differs considerably from the 3T protocol used in ADNI1 and is unique for each type of machine (e.g. GE, Phillips). View the MRI Scanner Protocols for a more detailed explanation. DTI and fMRI scans were added in ADNI GO and ADNI2, whereas participants from ADNI1 only received structural MRIs.
A list of Standardized MRI Datasets has been developed to help streamline and unify the data analysis process. Learn more about the datasets and how to download them.
Additional Resources:
- ADNI3 MRI Analysis Manual
- ADNI3 MRI Technical Manual
- ADNI 3 MRI Protocols Quick Guide
- ADNI3 MRI Scanner Protocols