One of the goals of ADNI is the collection of biospecimens, including blood, urine, and cerebrospinal fluid (CSF) from participants. Interested investigators, whether associated with an ADNI site or not, are encouraged to apply for use of this limited resource. However, use of ADNI samples for technology development or comparisons among different technologies is not recommended for well-established analysis unless there is preliminary data showing clearly superior performance.
Additionally, several analyses results performed by the ADNI Biomarker Core will be available in the Data Archive as follows:
- Homocysteine
- Species of isoprostanes
- CSF tau, sAPP? levels, BACE levels, and enzyme activity
- Plasma A? 40 and A? 42
- Other promising CSF and plasma based on ongoing multiplex immunoassay studies and mass spectrometry MRM studies
For information about access to biospecimen samples, or to apply, visit the Access Samples page. View methodology documents provided by the respective labs in the Biomarker Analysis section.
ADNI 1 Biospecimen Collection
| All Participants: |
Urine |
all visits |
| Plasma from Blood |
all visits |
| Serum from Blood |
all visits |
| CSF |
baseline and month 12 |
| Blood for NCRAD |
baseline |
| Blood for APOE |
screening |
| Cell Immortalization |
baseline |
CSF1: CSF was not collected from everyone in ADNI-1, just those that volunteered and consented to have a lumbar puncture. Urine and blood were collected on everyone
ADNI GO Biospecimen Collection
| EMCI Participants: |
CSF |
screening |
| Plasma from Blood |
all visits |
| Serum from Blood |
all visits |
| APOE/GWAS |
baseline |
| Cell Immortalization |
baseline |
| ADNI 1 Continuing Participants: |
RNA |
|
| GWAS |
|
ADNI 2 Biospecimen Collection
| New Controls, EMCI and LMCI Participants: |
CSF |
baseline and every two years |
| Buffy Coat |
all visits |
| Plasma from Blood |
all visits |
| Serum from Blood |
all visits |
| RNA |
baseline, then yearly |
| APOE/GWAS |
baseline |
| Cell Immortalization |
baseline |
| New AD Participants: |
CSF |
baseline and Month 24 |
| Buffy Coat |
all visits |
| Plasma from Blood |
all visits |
| Serum from Blood |
all visits |
| RNA |
baseline, Months 12 and 24 |
| APOE/GWAS |
baseline |
| Cell Immortalization |
baseline |
| ADNI 1/GO Continuing Participants: |
CSF |
1st ADNI 2 visit, then every two years |
| Buffy Coat |
1st ADNI 2 visit, then yearly |
| Plasma from Blood |
1st ADNI 2 visit, then yearly |
| Serum from Blood |
1st ADNI 2 visit, then yearly |
| RNA |
1st ADNI 2 visit, then yearly |
| GWAS |
1st ADNI 2 visit if not obtained in ADNI GO |
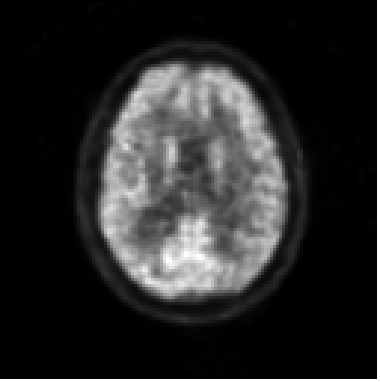
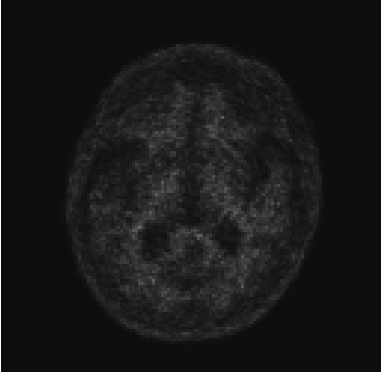
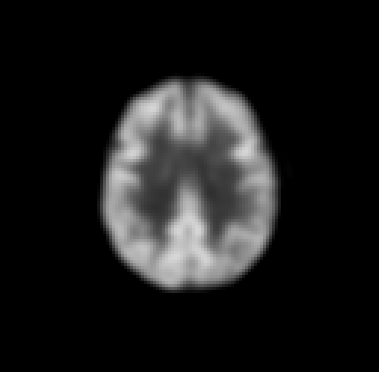
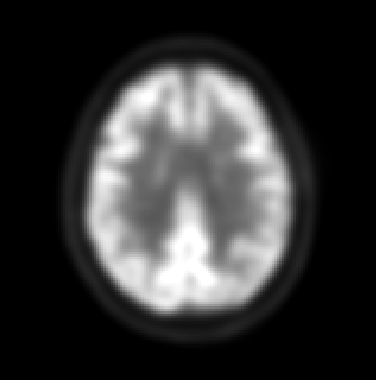
RAW, PRE- AND POST-PROCESSED IMAGE FILES, PIB (ADNI1), FDG (ADNI1/GO/2), FLORBETAPIR (ADNI GO/2/3), FLORBETABEN (ADNI3), and TAU IMAGING (ADNI3)
The collection of these images is central to meeting ADNI’s objective of developing biomarkers to track both the progression of Alzheimer’s disease and changes in the underlying pathology. The table below represents an overview of the PET data collected throughout the ADNI study (see table superscript references in the following paragraph).

ADNI 3: Tau and Amyloid imaging will be performed on all participants at their initial ADNI 3 visit. The subsequent Tau imaging schedule depends on amyloid status: 80% of amyloid positive and 20% of amyloid negative participants will have three additional tau scans, whereas the remaining 80% of amyloid negative and 20% amyloid positive participants will have 1 additional tau scan (see diagram). Amyloid PET imaging will be performed every 2 years using florbetapir (participants continuing from ADNI2) or florbetaben (newly enrolled participants). FDG-PET imaging will only be performed on MCI and AD participants at baseline only (see diagram).
ADNI 2: Florbetapir (formerly AV-45)1 PET and FDG PET imaging were performed on all newly enrolled participants on two separate days (minimum 12hr time lapse). Scans were performed within two weeks before or two weeks after the in-clinic assessments at Baseline and at 24 months after Baseline. ADNI 2 subjects had up to 3 florbetapir scans and up to 2 FDG scans, each acquired at 2-year time intervals.
ADNI 1/GO: Patients in ADNI1 initially received PIB32 scans instead of Florbetapir scans. However, the protocol was amended before the conclusion of the study to include the adoption of Florbetapir scans over PIB scans due to processing time limits. Therefore, PIB was only used on a small set of participants (approximately 100) in ADNI 1. For ADNI1 CN and MCI participants who continued into ADNI GO and then to ADNI2, initial PET scans occur two years from that date of the last successful Florbetapir and FDG PET scan under ADNI GO. In ADNI1, only a subset of participants received FDG.
For more information, please refer to the study protocols and the FAQ page.
Note: When searching the database for baseline or Timepoint 1? data, users should select both “screening” and “baseline” from the visit selection box.
Available Image Data

Download the PDF here. Note that not all subjects will have every type of image data, depending on the study and acquisition site.
Additional Resources:
Post-Processed PET warped with Talairach
Co-Registered Processed PET
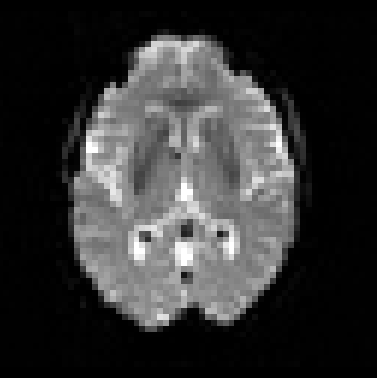
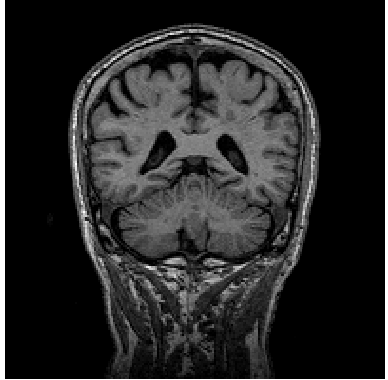
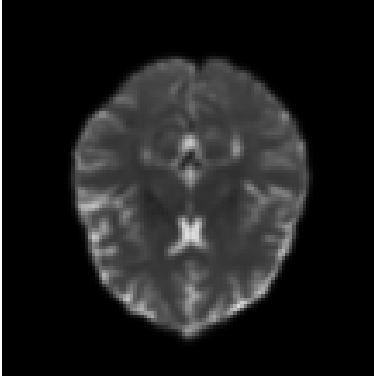
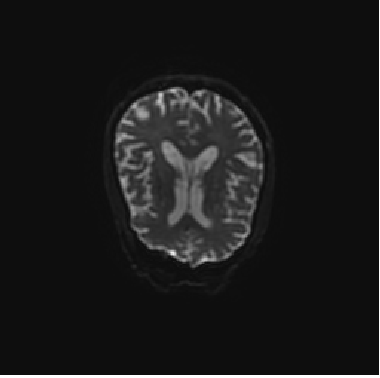
RAW, PRE- AND POST-PROCESSED IMAGE FILES, fMRI AND DTI
The collection of these images is central to meeting ADNI’s objective of developing biomarkers to track both the progression of Alzheimer’s disease and changes in the underlying pathology.
The table below represents an overview of the MRI data collected throughout the ADNI study.

Since its launch in 2004, the overarching aim of the ADNI study has been realized in informing the design of therapeutic trials in AD. ADNI3 continues the previously funded ADNI1, ADNI-GO, and ADNI2 studies that have combined public/private collaborations between academia and industry to determine the relationships between the clinical, cognitive, imaging, genetic and biochemical biomarker characteristics of the entire spectrum of sporadic late onset Alzheimer’s disease (AD).
Our strategy is based on the concept that AD can be characterized by the accumulation of A? and phosphorylated tau, synaptic loss and neurodegeneration, leading to cognitive decline. Clinical/cognitive measures lack both sensitivity and specificity to detect AD pathology. Instead, biomarkers are more reliably used to identify participants at risk for cognitive decline and to measure disease progression. This project will collect MRI (structural, diffusion weighted imaging, perfusion, and resting state sequences); amyloid PET using florbetapir F18 (florbetapir) or florbetaben F18 (florbetaben); 18F-FDG-PET (FDG-PET); CSF for A?, tau, phosphorylated tau (AKA phosphotau), and other proteins; AV-1451 PET; and genetic and autopsy data to determine the relationship of these biomarkers to baseline clinical status and cognitive decline.
The data types and responsible PIs are listed below. These numeric data types are provided for each MR exam in ADNI 3. For full details see the ADNI 3 MRI User Manual on either the Documents page or the ADNI 3 page. Details about each associated PI can be found on the Methods and Tools page.
Structural MRI
Four ADNI MR labs are funded to analyze 3D T1 scans: Paul Thompson (USC), tensor based morphometry; Nick Fox (UCL), boundary shift integral; Dugyu Tosun (UCSF), freesurfer; Mathew Senjem (Mayo Clinic), Tensor based morphometry symmetric normalization (TBM-SyN).
FLAIR
Charles DeCarli (UCD) – cerebro vascular disease metrics: white matter hyperintensity volume and brain infarctions
T2 GRE
DTI
Paul Thompson (USC) and Charles DeCarli (UCD) provide analyses of regional fractional anisotropy, diffusivity and more advanced metrics from diffusion weighted imaging (DWI). After visual inspection and automated brain extraction (skull-stripping), all raw DWI are corrected for motion, eddy-current and echo-planar imaging (EPI) induced susceptibility artifacts. A single diffusion tensor (DTI) is fitted to corrected DWI scans with FSLs dtifit; scalar fractional anisotropy (FA) and mean, radial and axial diffusivity (MD, RD, AD) maps are obtained from the resulting tensor eigenvalues. These corrected DWI and scalar maps are also made available for download. The FA image from the JHU DTI atlas (Mori et al., 2008) is warped to each subject and the deformation applied to the stereotaxic JHU Eve white matter (WM) atlas labels. For each subject, the average FA, MD, RD, and AD are subsequently extracted from 57 WM regions of interest (ROIs) and are made available for download. For a complete list of ROIs and pre-processing steps please refer to Nir et al. (2013) or the ADNI website. As ADNI3 collects multi-shell and higher angular resolution DWI, we are currently also evaluating beyond-tensor diffusion metrics for monitoring brain aging, such as TDF-FA and related metrics (Nir et al., Magn. Res. Med., 2017).
fMRI
Jeff Gunter and David Jones (Mayo) provide a summary connectivity metric for all scans
ASL
Dugyu Tosun provides regional perfusion measures
Hippocampal T2
Paul Yushkevich and Sandy Das (UPenn) provide volumetric measurements of hippocampal subfields and extra-hippocampal medial temporal cortex subregions. These measurements are generated by applying ASHS software (https://sites.google.com/site/hipposubfields/ ) to the hippocampal T2-weighted MRI scan. If you are going to use these for analysis, here are the things to keep in mind:
- Take note of the QA columns, which describe image quality on a scale from 0 (worst) to 4 (best). These represent overall usability of the T2-weigthed images and we dont recommend using volumetric data for any image with a QA rating <= 1. Common factors contributing to low QA score are motion artifacts and slab orientation and positioning errors.
- For extrahippocampal cortical regions ERC, PHC, BA35 and BA36, use a normalized volume which can be obtained by dividing the raw volumes by the number of slices in which the ROI appears. This is because the segmentation of these regions along the MRI slice direction is partial. See Yushkevich et al. (PMID: 25181316) for additional details.
- CA2 and CA3 measurements are noisy due to the small size of these subfields. We recommend using CA1, or a combined CA (1+2+3) in your analysis if you can.
If you are going to be generating the segmentation yourself using the ASHS software, here are the things to keep in mind:
- Make sure to use an appropriate atlas. For ADNI data, you should use the 3T Penn Memory Center atlas.
- The manual segmentation protocol fully labels a certain number of coronal slices. However, the variability of the slice orientation across subjects may result in the automatic segmentation having straddler voxels labeled as one of the cortical regions at the anterior/posterior-most slices. You may want to disregard these voxels when estimating volumes. A heuristic we use is to discard all extrahippocampal voxels in a slice when the number of such voxels is below 25% of the median across slices.
Available Image Data

Click here to download the PDF. Note that not all subjects will have every type of image data, depending on the study and acquisition site.
Study Update: MRI
The 3T MRI imaging protocol for ADNI GO differs considerably from the 3T protocol used in ADNI1 and is unique for each type of machine (e.g. GE, Phillips). View the MRI Scanner Protocols for a more detailed explanation. DTI and fMRI scans were added in ADNI GO and ADNI2, whereas participants from ADNI1 only received structural MRIs.
A list of Standardized MRI Datasets has been developed to help streamline and unify the data analysis process. Learn more about the datasets and how to download them.
Additional Resources:
Processed DTI with EPI Correction
Post-Processed MRI using FreeSurfer
DEMOGRAPHICS, CLINICAL ASSESSMENTS, AND COGNITIVE ASSESSMENTS
The ADNI clinical dataset comprises clinical information about each subject including recruitment, demographics, physical examinations, and cognitive assessment data. The full set of clinical data may be downloaded in bulk as comma separated values (CSV) files.
The chart below summarizes clinical data that is collected.

ADNI clinical data are collected and managed by the Alzheimers Therapeutic Research Institute (ATRI).
ILLUMINA SNP GENOTYPING
Genetic factors play an important role in Alzheimer’s disease. Therefore, a key aim of the ADNI is to provide researchers with the opportunity to combine genetics with imaging and clinical data to help investigate mechanisms of the disease. Genotyping and sequencing data have been generated for ADNI 1, ADNI GO and ADNI 2 subjects and are available to ADNI investigators. A summary of the available data is shown below. Please see the Genetic Data Methods section for more information about the Illumina Genotyping Assays.
Summary of Available Sequencing Data
|
ADNI 1 GWAS |
ADNI GO/2 GWAS |
ADNI WGS |
| Genotyping Platform |
Illumina Human610-Quad BeadChip |
Illumina HumanOmniExpress BeadChip |
Illumina Omni 2.5M (WGS Platform) |
| Number of SNPs |
620,901 SNP &
CNV Markers |
730,525 SNP &
CNV Markers |
#SNPs: ~3.7 million
#Indels: ~700,000
#SVs: ~3,500 |
| Patients Diagnosis Groups |
NC, MCI, AD |
NC, EMCI, MCI,
LMCI, AD |
NC, MCI, AD |
| Number of Subjects |
818 |
432 |
818 |
| File format |
CSV, PLINK |
CSV |
VCF (version 4.1) |
Summary of Available Genotyping Data
| Type |
Overview |
File Format |
APOE
Genotyping |
The epsilon 4 allele of APOE is the strongest known genetic risk factor for AD with a two- to three-fold increased risk for AD in people with one epsilon 4 allele rising to about 12-fold in those with two alleles. APOE genotyping was performed at the time of participant enrollment and included in the ADNI database. The two SNPs (rs429358, rs7412) that define the epsilon 2, 3, and 4 alleles, are not on the Human610-Quad BeadChip, and therefore were genotyped using DNA extracted by Cogenics from a 3 mL aliquot of EDTA blood. |
CSV |
| TOMM40 PolyT Variant |
Genotyping of the risk gene, TOMM40 (translo-case of outer mitochondrial membrane 40), was performed by Polymorphic DNA Technologies. Support for the PolyT assays was generously provided by Allen Roses of Duke University. The ADNI Genetics Core and NCRAD supported DNA preparation. Michael Lutz of Duke University provided bioinformatics expertise. |
CSV |
Genome-Wide Association Studies
Genome-wide association studies (GWAS) employ tests of association between markers, called single nucleotide polymorphisms (SNPs), and a phenotype of interest. Findings from case-control GWAS and other types of genetic association studies can provide targets for examining quantitative phenotypes derived from ADNI imaging and other biomarker data sets. GWAS data is available for download to qualified researchers.
For more information, refer to the following paper:
“Alzheimer’s Disease Neuroimaging Initiative biomarkers as quantitative phenotypes: Genetics core aims, progress, and plans.” Saykin AJ, et al. Alzheimers Dement. 2010 May;6(3):265-73. doi: 10.1016/j.jalz.2010.03.013. PMID: 20451875
Whole Genome Sequencing (WGS)
In July 2012, the Brin-Wojcicki Foundation and the Alzheimer’s Association donated funds to support whole genome sequencing (WGS) of 818 ADNI participants (at the time: 128 with AD, 415 with MCI, 267 controls and 8 of uncertain diagnosis). Samples were sent to Illumina, where non-CLIA WGS, as well as Illumina Omni 2.5M genome-wide association study (GWAS) single nucleotide polymorphism (SNP) arrays, were performed on each sample and completed in Spring 2013. Basic quality control checks were then performed and additional checks are continually performed.
WGS SNPs data is currently available to authorized ADNI investigators from within the ADNI Archive. Many users will find this suitable for their needs. Because the actual raw data amounts to over 150TB, it cannot be reasonably distributed over the internet. However, if users wish to re-call variants or realign the reads using other toolkits, they may request access to the entire WGS raw dataset.
Summary of Whole Genome Sequencing Data
| Available Data |
Description |
File size |
File Format |
Method of Obtaining |
| WGS (GATK Call) SNV + Indel |
These variants were called using Broads Best Practices (BWA & GATK HaplotypeCaller). |
117GB |
VCF |
Download from ADNI Data Archive. |
| WGS (CASAVA Call) SNV |
These variants were called using Illuminas CASAVA software. |
52GB |
VCF |
Download from ADNI Data Archive. |
| Sequenced alignment data |
These are aligned sequencing data. Users can obtain these data to re-call variants or realign the reads if necessary. |
Over 150TB |
BAM |
Send hardware to LONI. |
*There are 809 individuals in the CASAVA VCF files and 808 individuals in the GATK VCF files.
Obtaining WGS Data
WGS SNPs data is available to authorized ADNI investigators from within the ADNI Data Archive. To obtain SNPs data, visit the Access Data page to apply for an account or to login. Once logged in, the data is located on the Download Genetic Data page.
WGS Assembly data amounts to approximately 150TB and therefore cannot be reasonably distributed through the ADNI Data Archive. Investigators seeking to obtain the WGS Assembly data must:
Instructions for Requesting WGS Assembly Data
Please follow these steps to acquire WGS Assembly data:
- Download, review and sign the ADNI Whole Genome Sequencing Data Use Agreement
- Email the completed agreement to adni@loni.usc.edu. Enter ADNI WGS Data Request in the subject line. Requests for data will be filled in the order received.
- The Laboratory of Neuro Imaging (LONI) will send an email confirmation with Aspera transfer instructions and login credentials.
For information on the collection, informed consent, sharing, storage, and quality control of WGS data, please refer to Introduction and Procedures for Accessing Data from Whole Genome Sequencing of ADNI.