×
  • Select the area you would like to search.
  • ACTIVE INVESTIGATIONS Search for current projects using the investigator's name, institution, or keywords.
  • EXPERTS KNOWLEDGE BASE Enter keywords to search a list of questions and answers received and processed by the ADNI team.
  • ADNI PDFS Search any ADNI publication pdf by author, keyword, or PMID. Use an asterisk only to view all pdfs.

METHODS AND TOOLS

A large part of the success of the ADNI study rests on the consistency of data collection and processing. To guarantee this success, the cores and PIs have created uniform procedures and protocols to be used by researchers participating in the study. ADNI offers detailed information on the research process to ensure that all labs, centers, and researchers participating in the study have the resources they need. To learn more about how ADNI data is collected, expand each section below.

Click each data type for details

Table 1.  Summary of CSF, Plasma, Serum, and Whole Blood Aliquots shipped to RARC-approved investigators
Shipment     

Date

Principal Investigator Project Specimen Type Specimen Number Data Upload to ADNI/LONI
Aug, 2021 Michael Pontecorvo, Eli Lilly & Co Diagnostic Performance Against the Brain PET Imaging Findings: Evaluation of a Novel Plasma ATN Biomarker Plasma 291 plasma from 279 unique participants plus 10 replicate samples Anticipated Upload 4th Q 2021
June, 2021 Ivana Delalle, Brown Univ miRNA Plasma 180 plasma including 60 HC, 60 MCI, 60 AD plus 10 replicate plasma samples Anticipated Upload 4th Q 2021
May, 2021 Carlos Cruchaga, Wash Univ CSF-derived miRNA’s as AD biomarkers in Plasma Plasma 367 Plasma     

10 replicates


Anticipated Upload 3rd Q 2021
November, 2020 Julie Saugstad, OHSU CSF-derived miRNA’s as AD biomarkers in Plasma Plasma & CSF 80 Plasma, 80 matched CSF for HC
 
80 Plasma, 80 matched CSF for AD
 
5 CSF replicates, 5 plasma replicates
Anticipated Upload 3rd Q 2021
April, 2021 Allan Levey, Emory University CSF proteome CSF 719 CSFs matched to Rima K-D serum
10 replicates
Anticipated Upload 4th Q 2021
3rd Q 2020 FNIH BC plasma Aβ study group Round robin for plasma Aβ42/40; p-tau pilot Plasma 130 ADNI GO/2 to each of 6 participating labs
2nd Q 2021
Nov, 2019 R Bateman, Wash U, LC/MSMS Aβ42/Aβ40 in CSF & plasma CSF/Plasma 638 plasma 487 CSF
Anticipated completion: 3rd Q 2021
August, 2019 Kina Hoglund, Kaj Blennow
Molndal, Sweden
{ELISA, Simoa}
Novel markers of tau pathology & synaptic loss
(TAU368 & GAP-43)
CSF 1,286 ADNIGO/2 Baseline + longitudinal samples, 20 replicates
Date Uploaded:
6/08/2021
July 2018 Robert Nagele, UMDNJ     

(Autoantibody Array)

Autoantibodies for AD detection Serum 406 ADNI1/GO/2 Baseline + Longitudinal Samples, 10 replicates Date Uploaded:
12/18/2018
March 2018  William Hu, Emory University Center for Neurodegenerative Diseases CSF Cytokines/Chemokines     

IA

CSF 388 ADNIGO/2 Baseline + longitudinal Samples, 10 replicates Date Uploaded:
1/04/2019
January 2018 FNIH BC/Caprion Proteome Inc., Washington DC/Montreal, Quebec, Canada {LC/MSMS} CMGA, NPTX2, VGF, CG2, FABP     

mrm/mass spectrometry

CSF 730 ADNI1, GO, 2 CSF Longitudinal Samples, 20 replicates Date uploaded:
April, 2019
November 2017 Randall Bateman, Washington University School of Medicine Ab42/Ab40 in plasma of FBP+ / FBP-     

mrm/mass spectrometry

Plasma 200 ADNI GO, 2 Baseline Plasma Samples, 20 replicates Date uploaded:
June, 2019
10/2017 for EI/FRB/MSD
9/2018 for S/S
Euroimmune, Fujirebio
MSD, Saladax/Siemens
New immunoassays for established AD biomarkers Residual CSF EI: 120 + 20 pool samples
FRB: 422 + 20 pool samples
MSD: 250 + 20 pool samples
S/S: 373 + 20 pool samples
MSD 8/9/18
Euroimmune
4/19/19
FRB 3rd Q 2019
September 2017 Carlos Cruchaga, Wash U, and Marc Suarez-Calvert, DZNE, Germany
{Immunoassays}
sTREM2 & Progranulin CSF 1859 ADNI 1, GO, 2 BAELINE + Longtitudinal samples Data uploaded: 2/23/2018
August 2017 Henrik Zetterberg, Molndal, Sweden
{Simoa}
NFL & Tau diagnosis/prognosis     

p-tau181 added

Plasma 3762 ADNI 1, GO, 2 longitudinal aliquot samples     

20 replicates

NfL : 10/13/2018; p-tau181 uploaded 6/2020
May 2017 Jing Zhang,     

Harborview Medical Center,

University of Washington School of Medicine

a-Syn, Tau, Ab for AD Diagnosis     Plasma 310 ADNI 1, GO, 2 samples     

10 replicates

Data uploaded:
8/31/2020
March 2017 Dan Rader,     

Perelman School of Medicine, University of Pennsylvania

Cholesterol efflux Serum 795 ADNI 1 baseline samples     

20 replicates

Data uploaded:    
2nd Q 2018
July 2016 Rima Kaddoura-Daouk
Duke University
{multiple LC/MSMS}
Metabolic networks Serum 905* ADNIGO/2 BL samples
15 triplicates
Each sub-aliquotted: 6,335 total
Data uploaded:     

Throughout 2017

9/15/2015 Ian Sherriff, PI     

Araclon Biotech

Aβ1-42 and Aβ1-40     

IA

Plasma 784 ADNI1, GO, 2     

longitudinal aliquot samples

759 PLA aliquots

25 Replicates

Data uploaded: 2/16/2016
3/17/2015 Jing Zhang, PI     

Harborview Medical Center, University of Washington School of Medicine

Total α-syn     

Ser129

Phosphorylated α-syn

IA

CSF *372 ADNI1 Baseline CSF aliquots samples     

*transferred from Geoff Baird

461 ADNI1, GO, 2

longitudinal aliquot samples

446 CSFs

15 Replicates

Data uploaded: 9/21/2016
9/23/2014 Dr. Kaj Blennow, PI   

Clinical Neurochemistry Lab

Tau  Plasma     

High sensitivity IA

Plasma 595 ADNI1 aliquot samples     

579 Baseline PLA

16 Replicates

Data uploaded: 8/4/2015
07/09/2014 Allan Levey, PI     

Emory University School of Medicine

DDE**     

Mass spectrometry

Plasma 221 ADNI1 aliquot samples     

211 Baseline PLA

10 replicates

Data uploaded: 11/12/2014
05/19/2014 Dr. Kaj Blennow, PI   

Clinical Neurochemistry Lab

Cerebrospinal fluid levels     

of neurogranin

Neurofilament Light (NFL)

CSF 416 ADNI1 aliquot samples     

400 Baseline CSFs

16 Replicates

Data uploaded: 8/20/2014
05/19/2014 Rima Kaddurah-Daouk, PI   

Duke University

Metabolic Pathways and Networks in Alzheimer’s Disease     

Mass spectrometry

Serum 833 ADNI1 aliquot samples     

813 Baseline SER

20 Replicates

Data uploaded: 8/14/2015
10/28/2013 Courtney  Sutphen, PI   

Washington Univ School of Medicine

Lab of Dr. Anne Fagan & David Holtzman

YKL-40 and VILIP-1 in     

Longitudinal CSF sample sets

CSF 612 ADNI1, GO, 2     

longitudinal aliquot samples

597 CSFs

15 Replicates

Data uploaded: 7/15/2015
Week of 9/24/2012 Lee Honigsberg, PI     

Nicholas Lewin-Koh, Angus Nairn, Les Shaw, Dan Spellman, Kristin Wildsmith, co-investigators

Steve Hoffmann, PhD

Scientific Program Manager

The FNIH Biomarkers Consortium

CSF proteomic study Caprion using     

mrm mass

spectrometry

CSF 306 ADNI1 aliquot samples     

290 Baseline CSFs

16 Replicates

Data uploaded: 4/04/2014
9/12/2012 Dr.Robert  Nagele, PI   

UMDNJ

Autoantibody biomarkers for detection and     

diagnosis of Alzheimer’s disease

Serum 100 ADNI1 aliquot samples     

50 Baseline MCI

50 Baseline NL

Data uploaded: 11/1/2012
5/9/2012 Geoff Baird, PI
Thomas Montine and Elaine Peskind, co-investigators     

University of Washington

Analyzing the CSF proteome with an oligonucleotideaptamer array CSF and Plasma 727 ADNI1 aliquot samples     

372 Baseline CSFs

and matching 355 PLA

Samples forwarded to Jing Zhang, PI
1/17/2012 Lee Honigsberg     

Nicholas Lewin-Koh, Angus  Nairn,

Les Shaw, Dan Spellman,

Kristin Wildsmith, co-Pis

Steve Hoffmann ,PhD, Scientific Program Manager The Biomarkers Consortium Foundation for the National Institutes of Health

Pilot Study     

CSF proteomics project Caprion using mrm mass spectrometry*

CSF 25  ADNI1  aliquot samples     

20 Baseline CSFs: 10 AD, 10 NL

and 5 aliquots of a CSF pool

Data uploaded: 4/04/2014 with the main mrm MSMS  Proteomic Study
9/26/2011 Mary J Savage, PI     

Dan Holder, co- PI

Merck

Judy Siuciak, PhD

Scientific Program Manager

The FNIH Biomarkers Consortium

BACE and sAPP in CSF     CSF 402 ADNI1 aliquot samples     

382 Baseline CSF

20 Replicates

Data uploaded: 4/24/2012
8/9/2011 William Potter, PI     

Eve Pickering, Mitch Kling, Les Shaw, Fred Immerman, co- investigators

Judy Siuciak, PhD

Scientific Program Manager

The FNIH Biomarkers Consortium

CSF proteomic     

study RBM*

CSF 317 ADNI1 aliquot samples     

311 Baseline CSFs

16 Replicates

Data uploaded: 01/03/2012
3/24/2011 Jing Zhang, PI     

Harborview Medical Center University of Washington

School of Medicine

ADNI RARC
CSF Proteomic study
CSF 390 ADNI1 aliquot samples     

Baseline CSFs:

92 AD, 187 MCI, 111 NC

Data uploaded: 3/11/2013
5/12/2010 1.  Holly Soares (2010-2011)     

Pfizer

Eve Pickering & Fred Immerman

Statistical analyses

William Potter, Max Kuhn, David Shera, Mats Ferm, Robert A Dean,AdamJ Simon, Frank Swenson, Judy Siuciak, June Kaplow, Madhay Thambisetty, Panayiotis Zagouras,  Walter Koroshetz, Hong Wan, John Q Trojanowski, Leslie M Shaw, co-Investigators

David Lee

Scientific Program Manager

Judy Siuciak

Scientific Program Manager

The FNIH Biomarkers Consortium

Foundation for the National Institutes of Health

2.  William Potter (2011- 2013)

Eve Pickering & Fred Immerman

Statistical analyses

Mitch Kling

Plasma proteomic study Rules Based Medicine (RBM)*     

CSF proteomic study RBM

Plasma     

CSF

1065 ADNI1 aliquot samples Baseline PLA:     

394 MCI, 111 AD, 57 NL

Year 1 PLA:

349 MCI, 98 AD, 56 NL

317 ADNI1 aliquot samples

311 Baseline CSFs

16 Replicates

Study data uploads:     

Plasma proteomics RBM study

Nov 19, 2010

CSF proteomics RBM study

January 3,2012

3/1/2010 John A. McIntyre, PI     

St. Francis Hospital

Redox Reactive Autoantibodies in ADNI subjects     

RARC/study phase 2

Serum 90  ADNI1 aliquot samples     

Baseline SER:

30 NC, 30 MCI and 30 AD

Data uploaded: 07/21/2011
7/14/2009 John A. McIntyre , PI     

St. Francis Hospital

Redox Reactive Autoantibodies in ADNI subjects, RARC/study phase 1 Serum 18 ADNI1 aliquot samples     

Baseline SER:

6 NC, 6 MCI and 6 AD

Data uploaded: 11/29/2009
7/13/2009 Lucas Restrepo, PI      

UCLA

Immuno signature of Alzheimer’s Disease: using a blood plasma test Plasma 100 ADNI1 aliquot samples      

Baseline PLA: 50 AD & 50 NL

Study not completed
12/4/2007 Andy Saykin (2007- 2009)     

Dietrich Stephan, co-PI

Indiana University

Steven Potkin (2007- 2009)

UC Irvine

Andrew Saykin, co-PI

Indiana University

Whole genome analysis of ADNI1 cohort following DNA extraction(at Cogenics)     

Genetic association analysis of the ADNI 1 cohort

Whole     

blood

807 ADNI1 aliquot samples     

ADNI 1 Screening/Visit1 ApoE residual samples

Data uploaded: 3/16/2009


*PPSB Proteomic studies
** DDE, a metabolite of pesticide DDT (dichloro-diphenyl-trichloroethane)

Table 2.  Overview of CSF, Plasma, Serum, Whole Blood Aliquots shipped
Sample  # Aliquots Shipped to RARC investigators
  ADNI1/GO/ ADNI3: 2016-2021
CSF 3618 6794
Plasma 2336 6688
Serum 1041 2106
Whole blood

807

_

Total 7802 15,588


The table above is a description of aliquots that were sent to other investigators in the past 14 years (2007 through August 2021). A total of 6794 CSF, 6688 plasma, and 2106 serum sample aliquots were shipped to RARC/NIA-approved investigators during the time span of the ADNI3 study.

The neuropathology data in the ADNI database are derived from the National Institute on Aging-Alzheimer’s Association guidelines for the neuropathologic assessment of Alzheimer’s disease (AD) (1). The neuropathologic data may be considered the “gold standard” against which other clinical, neuropsychological, genetic, neuroimaging and body fluid biomarkers may be compared. Neuropathology data may be used to underpin multimodal studies of the natural history of AD.

Acquisition of Neuropathology Data

Pathological lesions within the brain have been assessed using established neuropathologic diagnostic criteria. The NIA-AA criteria recognize that AD neuropathologic changes may occur in the apparent absence of cognitive impairment. Using the NIA-AA protocol, an “ABC” score for AD neuropathologic change is generated which incorporates histopathologic assessments of amyloid? deposits (A), staging of neurofibrillary tangles (B), and scoring of neuritic plaques (C). In addition, detailed methods for assessing commonly co-morbid conditions such as Lewy body disease, vascular brain injury, hippocampal sclerosis, and TAR DNA binding protein (TDP) immunoreactive inclusions are included (1).

Neuropathology data were captured in the format of the Neuropathology Data Form Version 10 of the National Alzheimer’s Coordinating Center (NACC) established by the National Institute on Aging/NIH (U01 AG016976). For more information see:

Neuropathology Coding Guidebook NACC Version 11
Neuropathology Data Collection Form NACC Version 11
Neuropathology Data Dictionary NACC Version 11

Description of Brain Regions Sampled

The brain areas sampled for microscopic assessment are described in the Neuropathology Core – MICROSCOPY DATABASE FORM 02-13-2020 (see below). These data are included in the Neuropathology Data Set. Brain areas sampled include:

  1. Middle frontal gyrus (Block 1)
  2. Superior and middle temporal gyri (Block 2)
  3. Inferior parietal lobe (angular gyrus) (Block 3)
  4. Occipital lobe to include the calcarine sulcus and parastriate cortex (Block 4)
  5. Anterior cingulate gyrus at the level of the genu of the corpus callosum (Block 19)
  6. Precentral gyrus (Block 21)
  7. Posterior cingulate gyrus and precuneus at the level of the splenium (Block 30)
  8. Amygdala and entorhinal cortex (Block 23)
  9. Hippocampus and parahippocampal gyrus at the level of the lateral geniculate nucleus (Block 5)
  10. Striatum (caudate nucleus and putamen) with olfactory cortex at the level of the nucleus accumbens (Block 6)
  11. Striatum and pallidum at the level of the anterior commissure to include nucleus basalis of Meynert, basal forebrain, and septum (Block 17)
  12. Thalamus and subthalamic nucleus (Block 8)
  13. Midbrain with red nucleus (Block 9)
  14. Pons with locus coeruleus (Block 11)
  15. Medulla oblongata (Block 12)
  16. Cerebellum with dentate nucleus (Block 14)
  17. Spinal cord (Block 13)
Dataset Information

This methods document applies to the following dataset(s) available from the ADNI repository:

Dataset Name

Date Submitted

Neuropathology Core – Data Dictionary

01 March 2018

Neuropathology Core – Data Methods

01 March 2018

Neuropathology Core – Neuropathology Data

01 March 2118

Positron Emission Tomography (PET) image analysis was funded by ADNI for the following labs.  Below is a summary of the PET analysis methods. Anyone with an ADNI Data Archive account may view and download the analysis methods and the analyzed data. After logging in, click “Download” and “Study Data” to see all relevant ADNI documents available for download.

Banner Alzheimer’s Institute
Co-investigator: Eric Reiman

The Banner Alzheimer’s Institute (Arizona) of the ADNI PET Core analyzes the FDG-PET data using the computer package SPM5 to examine the progression that correlates with changes in cognition and to evaluate cross-sectional differences among three diagnostic groups: patients with AD, patients with MCI and normal healthy controls. All PET from the post-processed group-4 images were downloaded from the ADNI data archive in NIFTI format.

  • Summary of Statistical Parametric Mapping (SPM) Image Analysis
  • SPM Methods, Results and SPM-based Global Indices
Jagust Lab, UC Berkeley
Co-investigator: William Jagust

Processed FDG Data Methods
A literature search on PubMed was conducted using permutations of six terms relating to FDG-PET, AD, and MCI in order to identify studies that carried out direct whole-brain contrasts of FDG data and reported Z-scores or T-values corresponding to MNI or Talairach coordinates that represented regions in which FDG uptake differed significantly between patients (AD or MCI) and controls. This resulted in a total of 15 studies involving a cross-sectional comparison of AD, MCI, and/or Normal groups and 178 MNI and Talairach coordinates. A spreadsheet of these coordinates, associated t-values or z-scores was created. Talairach coordinates were transformed into MNI space, and t-values were converted to z-scores, which were then mapped to the space of the MNI template brain as intensity values. There were 14 overlapping coordinates, and their z-scores were added. Resulting images were smoothed with a standard 14 mm FWHM kernel. The values of all voxels in the image were then normalized, resulting in an image with values between 0 and 1.

Processed Florbetapir (AV45) Data Methods
The Florbetapir methods description contains an explanation of the Freesurfer-based processing stream, and also a description of the methods used to derive our Florbetapir cutoff for this dataset. These processing methods were developed at Dr. William Jagust’s laboratory of the Helen Wills Neuroscience Institute, UC Berkeley and Lawrence Berkeley National Laboratory.

PET Facility, University of Pittsburgh
Co-investigator: Chester Mathis

An automated template-based method was used to sample multiple regions-of-interest (ROIs) on the ADNI PIB SUVR image. The PIB SUVR was downloaded from the ADNI website along with its corresponding ADNI Processed #3 MR image. The MR image choice was scanner dependent. The #4 PIB SUVR image has been co-registered to the first frame of the raw image file and averaged across frames (for dynamic acquisitions only), reoriented to Talairach space, intensity normalized so that the average of voxels within the mask was exactly 1, and smoothed to achieve a uniform isotropic resolution of 8 mm FWHM. Fourteen ROIs were generated.

 SUVR Re-Normalized to CER

Results were compiled with the following data:

Subject ID, Group, Sex, Age, Study Date, Study UID, Series UID, Image UID, ACG (Anterior Cingulate), FRC (Frontal Cortex), LTC (Lateral Temporal Cortex), PAR (Parietal Cortex), PRC (Precuneus Cortex), MTC (Mesial Temporal Cortex), OCC (Occipital Cortex), OCP (Occipital Pole), PON (Pons), AVS (Anterior Ventral Striatum), CER (Cerebellum), SMC (Sensory Motor Cortex), SWM (Sub-cortical White Matter), THL (Thalmus)

 Delineated ROIs

  • AD Region of Interest PIB PET: Images of the scans with ROIs delineated. Related to Alzheimer’s disease (AD)
  • MCI Region of Interest PIB PET: Images of the scans with ROIs delineated. Related to Mild Cognitive Impairment (MCI)
  • Normal Subjects Region of Interest PIB PET: Images of the scans with ROIs delineated. Related to Normal Subjects (NL)
University of Utah Center for Alzheimer’s Care, Imaging and Research (CACIR)
Co-investigator: Norman L. Foster

The focus of The University of Utah component of the PET Imaging Core is on the individual image analysis and processing of molecular imaging data using 3-dimensional stereotactic surface projections (3D-SSP) computed by Neurostat, developed by Satoshi Minoshima [Minoshima et al., J Nucl Med 1995; 36:1238-48].

We have uploaded baseline ADNI1 FDG-PET images warped into Talairach space in dicom format. We have provided a document with 3D-SSP images of AD subjects showing a pattern of glucose hypometabolism that is consistent with frontotemporal dementia. We submit 6 numeric summary values that encapsulate information on the spatial extent and the severity of hypometabolism from FDG-PET and amyloid uptake values from amyloid-PET scans. We compute the averaged uptake values in 18F-FDG, 18F-AV45 and 11C-PIB images, for regions that are typically relevant to Alzheimer’s Disease: the frontal and association cortices. We also compute the differences of subjects compared to a control group by pixel-wise computation of Z-scores in Talairach space. For FDG scans, we submit the number of pixels significantly hypometabolic compared to a group of elderly normal subjects. These are normalized to pons. For amyloid scans, we submit the number of pixels with significant increased uptake compared to a group of amyloid negative subjects. These are normalized to cerebellum and total white matter. Our numeric summary value reporting the spatial extent of significant change counts the significant Z-scores. The numeric summary value that reports the severity of the deviations with spatial extent sums the significant Z-scores. For FDG scans, these values report the extent of hypometabolism, and for the amyloid scans, these values report the increase in tracer uptake.

Center for Brain Health, NYU School of Medicine
Mony J. de Leon

Hippocampal Glucose Metabolism Sampling, the NYU HIPMASK
We developed, validated, and published the HIPMASK technique for measurement of the HIP and other structures. HIPMASK generates a 3-D HIP sampling mask to accurately sample true HIP tissue with approximately 95% anatomical overlap between the HIPMASK and the co-registered MRI in normal elderly, MCI and AD groups.

Quality Control
  • Every Florbetapir and FDG PET scan is reviewed for protocol compliance by the ADNI PET QC team
  • If a correctable problem is identified, the PET QC team contacts the PET technologist directly
  • If a problem with the scan is identified and it is not fixable, the PET QC team provides the PET technologist with protocol guidance to apply to future PET scans

Scans that fail the PET QC and are deemed unusable due to participant motion or non-compliance are documented with the reason as identified by the participant and the technician on the PET Scan Information Form. In these instances, rescans are only scheduled if the participant’s motion is believed to be correctable and is not a result of chronic illness or deteriorated cognitive ability.

Illumina Method

To address DNA strand designation and orientation, Illumina has developed a consistent and simple method to ensure uniformity in the reporting of genotype calls.

Initially, we used Illumina BeadStudio 3.2 software to generate SNP genotypes from bead intensity data. After performing sample verification and quality control bioinformatics, the genotype data for 818 ADNI participants was made available to qualified researchers. Reprocessed array data was made available in 2010 using an updated version of BeadStudio, Illumina GenomeStudio v2009.1, for all 818 samples. Although the 2010 files are highly similar to the initial release, a comparison of calls for all 620,901 markers (from the two versions of Final Reports for each sample) indicated that only nine samples had mismatches in genotypes successfully called in the two versions, and those mismatches comprised <0.01% of all markers. Finally, a new DNA source file is included in the downloads to identify whether peripheral blood (n = 731) or immortalized LCL (n = 87) derived DNA was analyzed for each genotyped sample.

For ADNI GO/ADNI 2, genotyping was performed on 85 genomic DNAs using the Illumina HumanOmniExpress BeadChip, which contains 730,525 SNP markers, according to the manufacturer’s protocols.

Resources:

The Biomarker Core in ADNI3 is focusing on 4 areas of activity and studies including: biofluid banking (CSF, plasma and serum) management and pre-analytical assessments;  standardization of CSF Ab42, Ab40, t-tau and p-tau181 measurement in ADNI patients using the highly validated Roche Elecsys cobas e 601 fully automated immunoassay platform and reference LC/MSMS methodology for CSF Ab42, Ab40 and Ab38; determination of cut-points for Ab42, t-tau, p-tau181, and ratios using several approaches including ROC analyses using FBP amyloid PET imaging for disease detection and disease independent mixture modeling; collaborative studies on new biomarker development/validation/testing in CSF or plasma by immunoassay or mrm LC/MSMS including NFL, total and phospho-a-synuclein, Vilip-1, sTREM2, progranulin, TDP-43, metabolomics/lipidomic biomarkers and proteomic quantitative assays.

Leslie M Shaw and John Q Trojanowski co-lead the ADNI Biomarker Core at the University of Pennsylvania.

Highlights of Biomarker Core activities include:


Multicenter Multivariate Studies
Alzheimer’s Disease (AD) Neuroimaging Initiative (ADNI) Related Biofluid And Genetic Biomarker Studies Using Non-ADNI University Of Pennsylvania (UPenn) Biosamples From Patients Followed Longitudinally Affected By AD, Parkinson’s Disease With (PDD) And Without (PD) Dementia, Frontotemporal Degeneration (FTD), Amyotrophic Lateral Sclerosis (ALS) Or Related Neurodegenerative Diseases (ND)
John Q. Trojanowski and Leslie M. Shaw

The Center for Neurodegenerative Disease (ND) Research (CNDR; (http://www.med.upenn.edu/cndr/) is the home base of of several large programmatic grants focusing on basic science and patient oriented research begining in 1990 with an NIA funded PO1 on shared mechanisms of AD and PD led by John Trojanowski (PO1 AG-09215) that ran from 1990 to 2010 and then was continued from 2007 to the present as the Penn Udall Center (P50 NS-053488). In addition, there is a Penn AD Core Center (ADCC; P30 AG-10124-27) led by John Trojanowski, which has a dementia with Lewy Body (DLB) and frontotemporal degeneration (FTD) module, and an NIA funded PO1 on FTD led by Virginia Lee (P01 AG-17586-16) as well as a previously funded PO1 on ALS and TDP-43 (P01 AG032953) led by Virginia Lee. Of course there many other AD and related dementia (ADRD) grants at Penn including the AD Genetics Consortium led by Jerry Schelenberg and Li-San Wang, but the grants listed above follow patients longitudinally.

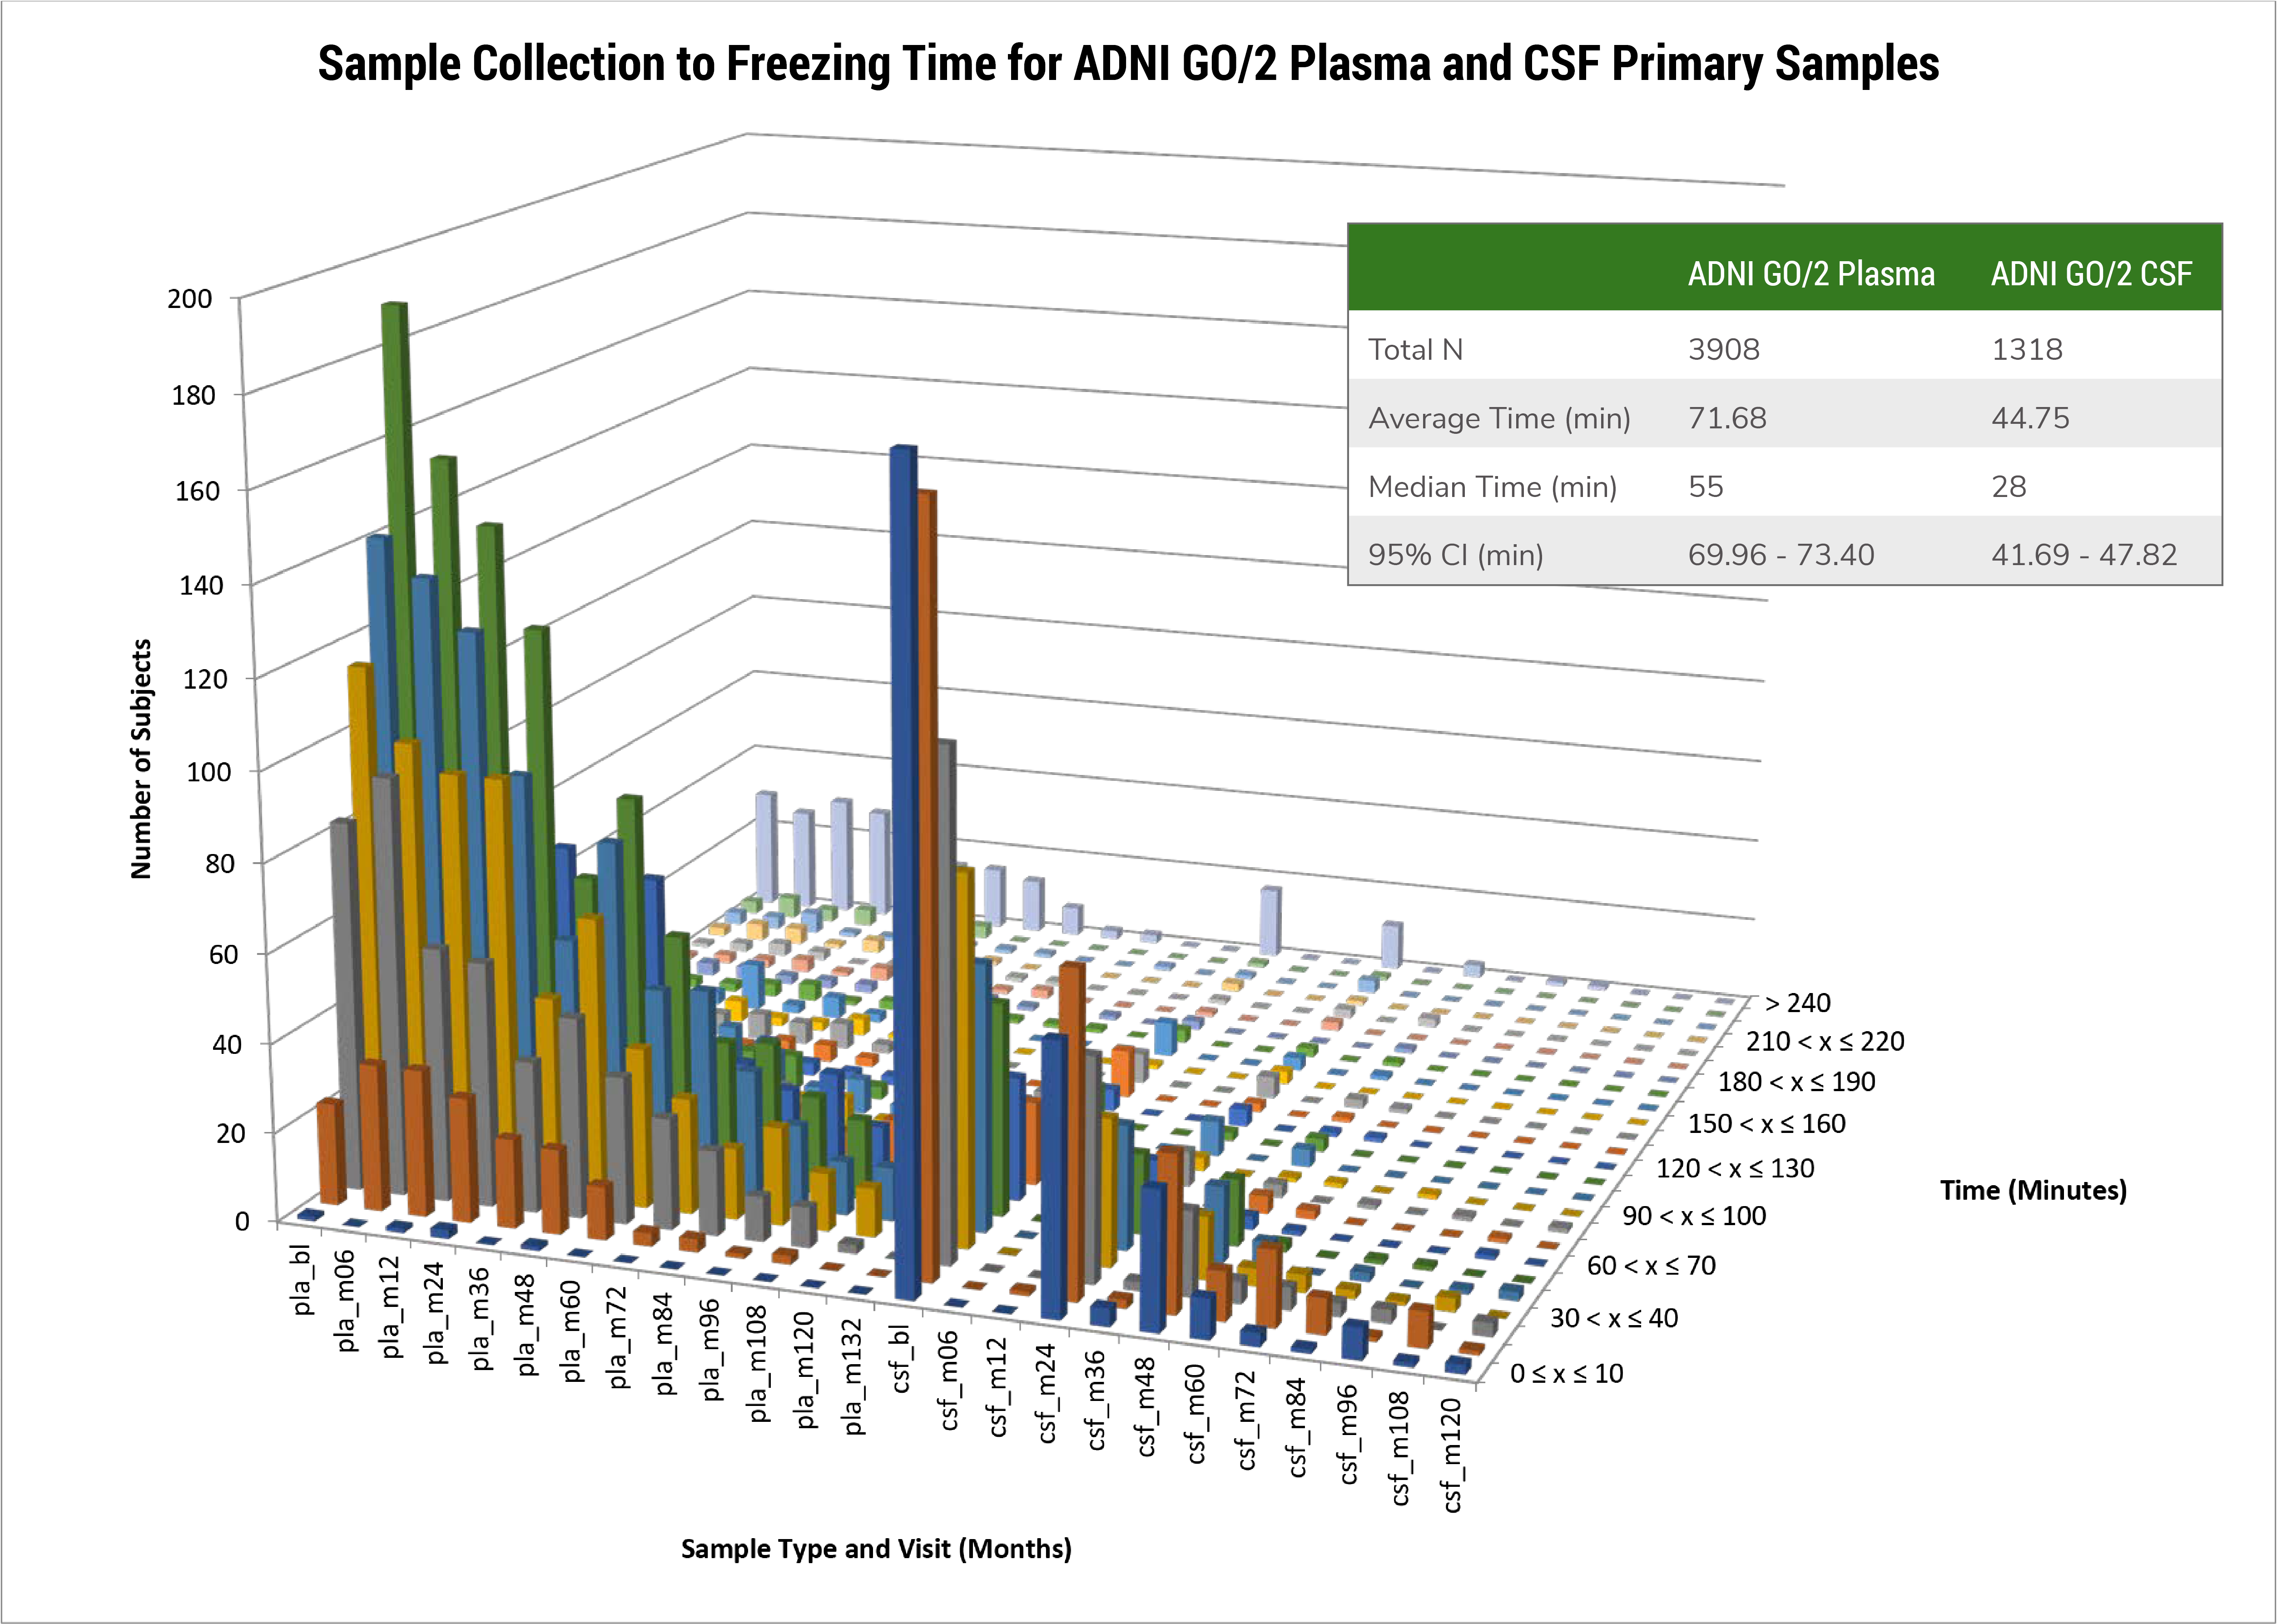
Thus, CNDR has systematically collected patient biosamples including CSF, DNA/RNA, plasma, serum, whole blood and postmortem brain samples since 1990 from longitudinally followed patients, many of whom consent to autopsy. Accordingly, CNDR has banked CNS tissues from >1,700 subjects with a primary diagnosis of AD, Lewy body demenias (LBD), FTD, ALS, related NDs and normal controls (NC). This includes cases with the following primary neuropathology diagnoses, although many have other or additional ND co-pathologies1 such as aging related astroglial tauopathy (ARTAG):2-4 576 AD, 120 PD, 134 PDD, 52 DLB, 55 MSA brains and 257 NC or pathological aging related tauopathy (PART).5 There also are 111 frontotemporal lobar degeneration (FTLD) due to TDP-32 inclusions (FTLD-TDP), 52 ALS, 50 CBD,106 PSP and 23 PiD brains. DNA from brain is available on >1500 (89%) of autopsies.  Some autopsy cases have paired DNA from  blood or saliva and brain (n=515).  DNA from peripheral blood is banked from approximately 480 NC and 3700 individuals in the following diagnostic categories: 1478 AD, 613 ALS, 573 FTLD, 1003 PD/PDD/DLB, 22 MSA. For archival biofluids, we have CSF samples from >1500 individuals in the following diagnostic categories: 634 AD, 507 FTLD, 202 PD/PDD/DLB, 151 ALS, and 105 NC. We have plasma samples from >3300 unique individuals in the following diagnostic categories: 859 AD, 504 FTLD, 948 PD/PDD/DLB, 545 ALS, and 454 NC. In nearly all cases, CSF is matched with plasma collected at the same time, and for many individuals, multiple samples have been collected longitudinally. Thus, our archived DNA/RNA and biofluid biosamples are extremely valuable for comparative studies across diverse ND and they have been used extensively in neuropathology, genetic and biomarker studies supported by the NIH funded grants noted above.1, 6, 7 Below are brief highlights of genetic and biofluid biomarker studies conducted on Penn non-ADNI biosamples mainly since 2013 that complement the biomarker studies done in ADNI with ADNI patient samples.

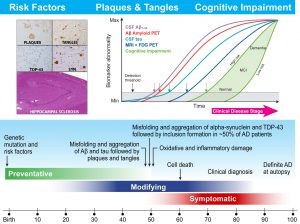
Studies conducted using these UPenn samples often include biosamples from other centers or investigators beyond Penn and the focus here is on biomarkers (mainly CSF, plasma and DNA, but some are combined with PET imaging and structural imaging data) and neuropathology. This is exemplified in particular by comparative studiesof AD and PD including: 1) Recognition of the contribution of co-morbid AD and alpha-synuclein (aSyn) pathology to cognitive decline in AD with concomitant aSyn pathlogy and LBD.8-13 Specifically, co-morbid A? and tau neuropathology, APOE ?4 genotype, lower CSF A?1-42 levels, and increasing A? amyloid burden on PET imaging are all associated with CI in PD. 2) Establishing that specific plasma biomarkers are predictors of CI in PD and AD.14-16  3) Comparing the differential effects of genetic factors on cognition in PD and AD.17-19 4) Other collaborative genetic17, 18, 20-34 and biofluid biomarker studies15, 35-52 demonstrate that SNPs and biofluid biomarkers changes can be disease specific or are altered in many ND. However, we have focused mainly on AD, PD and FTD in our Penn cohorts that enable comparisons of these UPenn data with data from ADNI subjects. Notably, we continue to expand our collaborations with the Blennow/Zetterberg group so that as ADNI Add-On studies identify potentially informative biomarkers in ADNI biosamples going forward, we will follow up with the interrogation of biosamples from the UPenn AD, PD, FTD and ALS subjects. Finally, it shoult be noted that our UPenn cohort is more diverse than the ADNI cohort and we have followed ~150 patients with antemortem biofluid draws to autopsy so we can extend the type of study we reported in Toledo et al.39 to our collaborations with the Blennow/Zetterberg group. This is exemplified in the Cullen et al collaborative study with the Blennow and Zetterberg group (In review , 2018) wherein we collected a panel of five CSF biomarkers ” A?42, total tau (t-tau), phosphorylated tau (p-tau), neurofilament light (NfL), and neurogranin (Ng) ” in 723 subjects representing nine neurodegenerative disorders including both an autopsy-confirmed AD cohort and a clinically representative, probable AD cohort. To seek to differentiate between AD and each of the other disorders in our study cohort, we identified univariate cutoff values of the most informative single biomarker and also fit a multivariate machine learning model using all biomarkers at once. As a result, we found that the multivariate predictive model achieved high differential diagnostic accuracy and greatly outperformed the univariate cutoff model. The strong results on both a gold standard, autopsy-confirmed AD cohort and a clinically representative AD cohort support the idea that this panel is capable of greatly improving patient selection in AD clinical trials.

REFERENCES

1)         Robinson JL, Lee EB, Xie SX, Rennert L, Suh E, Bredenberg C, Caswell C, Van Deerlin VM, Yan N, Yousef A, Hurtig HI, Siderowf A, Grossman M, McMillan CT, Miller B, Duda JE, Irwin DJ, Wolk D, Elman L, McCluskey L, Chen-Plotkin A, Weintraub D, Arnold SE, Brettschneider J, Lee VM, Trojanowski JQ. Neurodegenerative disease concomitant proteinopathies are prevalent, age-related and APOE4-associated. Brain;10.1093/brain/awy146, 2018.

2)         Kovacs GG, Ferrer I, Grinberg LT, Alafuzoff I, Attems J, Budka H, Cairns NJ, Crary JF, Duyckaerts C, Ghetti B, Halliday GM, Ironside JW, Love S, Mackenzie IR, Munoz DG, Murray ME, Nelson PT, Takahashi H, Trojanowski JQ, Ansorge O, Arzberger T, Baborie A, Beach TG, Bieniek KF, Bigio EH, Bodi I, Dugger BN, Feany M, Gelpi E, Gentleman SM, Giaccone G, Hatanpaa KJ, Heale R, Hof PR, Hofer M, Hortobagyi T, Jellinger K, Jicha GA, Ince P, Kofler J, Kovari E, Kril JJ, Mann DM, Matej R, McKee AC, McLean C, Milenkovic I, Montine TJ, Murayama S, Lee EB, Rahimi J, Rodriguez RD, Rozemuller A, Schneider JA, Schultz C, Seeley W, Seilhean D, Smith C, Tagliavini F, Takao M, Thal DR, Toledo JB, Tolnay M, Troncoso JC, Vinters HV, Weis S, Wharton SB, White CL, 3rd, Wisniewski T, Woulfe JM, Yamada M, Dickson DW. Aging-related tau astrogliopathy (ARTAG): harmonized evaluation strategy. Acta Neuropathol 131(1):87-102, 2016; PMCID: PMC4879001.

3)         Kovacs GG, Lee VM, Trojanowski JQ. Protein astrogliopathies in human neurodegenerative diseases and aging. Brain Pathol 27(5):675-90, 2017; PMCID: PMC5578412.

4)         Kovacs GG, Robinson JL, Xie SX, Lee EB, Grossman M, Wolk DA, Irwin DJ, Weintraub D, Kim CF, Schuck T, Yousef A, Wagner ST, Suh E, Van Deerlin VM, Lee VM, Trojanowski JQ. Evaluating the Patterns of Aging-Related Tau Astrogliopathy Unravels Novel Insights Into Brain Aging and Neurodegenerative Diseases. J Neuropathol Exp Neurol 76(4):270-88, 2017.

5)         Crary JF, Trojanowski JQ, Schneider JA, Abisambra JF, Abner EL, Alafuzoff I, Arnold SE, Attems J, Beach TG, Bigio EH, Cairns NJ, Dickson DW, Gearing M, Grinberg LT, Hof PR, Hyman BT, Jellinger K, Jicha GA, Kovacs GG, Knopman DS, Kofler J, Kukull WA, Mackenzie IR, Masliah E, McKee A, Montine TJ, Murray ME, Neltner JH, Santa-Maria I, Seeley WW, Serrano-Pozo A, Shelanski ML, Stein T, Takao M, Thal DR, Toledo JB, Troncoso JC, Vonsattel JP, White CL, 3rd, Wisniewski T, Woltjer RL, Yamada M, Nelson PT. Primary age-related tauopathy (PART): a common pathology associated with human aging. Acta Neuropathol 128(6):755-66, 2014; PMCID: PMC4257842.

6)         Toledo JB, Van Deerlin VM, Lee EB, Suh E, Baek Y, Robinson JL, Xie SX, McBride J, Wood EM, Schuck T, Irwin DJ, Gross RG, Hurtig H, McCluskey L, Elman L, Karlawish J, Schellenberg G, Chen-Plotkin A, Wolk D, Grossman M, Arnold SE, Shaw LM, Lee VM, Trojanowski JQ. A platform for discovery: The University of Pennsylvania Integrated Neurodegenerative Disease Biobank. Alzheimer’s Dement 10(4):477-84.e1, 2014; PMCID: PMC3933464.

7)         Arnold SE, Toledo JB, Appleby DH, Xie SX, Wang LS, Baek Y, Wolk DA, Lee EB, Miller BL, Lee VM, Trojanowski JQ. Comparative survey of the topographical distribution of signature molecular lesions in major neurodegenerative diseases. J Comp Neurol 521(18):4339-55, 2013; PMCID: PMC3872132.

8)         Akhtar RS, Xie SX, Brennan L, Pontecorvo MJ, Hurtig HI, Trojanowski JQ, Weintraub D, Siderowf AD. Amyloid-Beta Positron Emission Tomography Imaging of Alzheimer’s Pathology in Parkinson’s Disease Dementia. Movement disorders clinical practice 3(4):367-75, 2016; PMCID: PMC4971540.

9)         Akhtar RS, Xie SX, Chen YJ, Rick J, Gross RG, Nasrallah IM, Van Deerlin VM, Trojanowski JQ, Chen-Plotkin AS, Hurtig HI, Siderowf AD, Dubroff JG, Weintraub D. Regional brain amyloid-beta accumulation associates with domain-specific cognitive performance in Parkinson disease without dementia. PLoS One 12(5):e0177924, 2017; PMCID: PMC5444629.

10)       Irwin DJ, Grossman M, Weintraub D, Hurtig HI, Duda JE, Xie SX, Lee EB, Van Deerlin VM, Lopez OL, Kofler JK, Nelson PT, Jicha GA, Woltjer R, Quinn JF, Kaye J, Leverenz JB, Tsuang D, Longfellow K, Yearout D, Kukull W, Keene CD, Montine TJ, Zabetian CP, Trojanowski JQ. Neuropathological and genetic correlates of survival and dementia onset in synucleinopathies: a retrospective analysis. Lancet Neurol 16(1):55-65, 2017; PMCID: PMC5181646.

11)       Simuni T, Siderowf A, Lasch S, Coffey CS, Caspell-Garcia C, Jennings D, Tanner CM, Trojanowski JQ, Shaw LM, Seibyl J, Schuff N, Singleton A, Kieburtz K, Toga AW, Mollenhauer B, Galasko D, Chahine LM, Weintraub D, Foroud T, Tosun D, Poston K, Arnedo V, Frasier M, Sherer T, Chowdhury S, Marek K. Longitudinal change of clinical and biological measures in early Parkinson’s disease: Parkinson’s progression markers initiative cohort. Mov Disord;10.1002/mds.27361, 2018.

12)       Shi M, Tang L, Toledo JB, Ginghina C, Wang H, Aro P, Jensen PH, Weintraub D, Chen-Plotkin AS, Irwin DJ, Grossman M, McCluskey L, Elman LB, Wolk DA, Lee EB, Shaw LM, Trojanowski JQ, Zhang J. Cerebrospinal fluid alpha-synuclein contributes to the differential diagnosis of Alzheimer’s disease. Alzheimers Dement;10.1016/j.jalz.2018.02.015, 2018.

13)       Irwin DJ, Xie SX, Coughlin D, Nevler N, Akhtar RS, McMillan CT, Lee EB, Wolk DA, Weintraub D, Chen-Plotkin A, Duda JE, Spindler M, Siderowf A, Hurtig HI, Shaw LM, Grossman M, Trojanowski JQ. CSF tau and beta-amyloid predict cerebral synucleinopathy in autopsied Lewy body disorders. Neurology 90(12):e1038-e46, 2018; PMCID: PMC5874449.

14)       Lim NS, Swanson CR, Cherng HR, Unger TL, Xie SX, Weintraub D, Marek K, Stern MB, Siderowf A, Trojanowski JQ, Chen-Plotkin AS. Plasma EGF and cognitive decline in Parkinson’s disease and Alzheimer’s disease. Annals of clinical and translational neurology 3(5):346-55, 2016; PMCID: PMC4863747.

15)       Berlyand Y, Weintraub D, Xie SX, Mellis IA, Doshi J, Rick J, McBride J, Davatzikos C, Shaw LM, Hurtig H, Trojanowski JQ, Chen-Plotkin AS. An Alzheimer’s Disease-Derived Biomarker Signature Identifies Parkinson’s Disease Patients with Dementia. PLoS One 11(1):e0147319, 2016; PMCID: PMC4727929.

16)       Chahine LM, Stern MB, Chen-Plotkin A. Blood-based biomarkers for Parkinson’s disease. Parkinsonism Relat Disord 20 Suppl 1:S99-103, 2014; PMCID: PMC4070332.

17)       Mata IF, Leverenz JB, Weintraub D, Trojanowski JQ, Hurtig HI, Van Deerlin VM, Ritz B, Rausch R, Rhodes SL, Factor SA, Wood-Siverio C, Quinn JF, Chung KA, Peterson AL, Espay AJ, Revilla FJ, Devoto J, Hu SC, Cholerton BA, Wan JY, Montine TJ, Edwards KL, Zabetian CP. APOE, MAPT, and SNCA genes and cognitive performance in Parkinson disease. JAMA neurology 71(11):1405-12, 2014; PMCID: PMC4227942.

18)       Mata IF, Leverenz JB, Weintraub D, Trojanowski JQ, Chen-Plotkin A, Van Deerlin VM, Ritz B, Rausch R, Factor SA, Wood-Siverio C, Quinn JF, Chung KA, Peterson-Hiller AL, Goldman JG, Stebbins GT, Bernard B, Espay AJ, Revilla FJ, Devoto J, Rosenthal LS, Dawson TM, Albert MS, Tsuang D, Huston H, Yearout D, Hu SC, Cholerton BA, Montine TJ, Edwards KL, Zabetian CP. GBA Variants are associated with a distinct pattern of cognitive deficits in Parkinson’s disease. Mov Disord 31(1):95-102, 2016; PMCID: PMC4724255.

19)       Mata IF, Johnson CO, Leverenz JB, Weintraub D, Trojanowski JQ, Van Deerlin VM, Ritz B, Rausch R, Factor SA, Wood-Siverio C, Quinn JF, Chung KA, Peterson-Hiller AL, Espay AJ, Revilla FJ, Devoto J, Yearout D, Hu SC, Cholerton BA, Montine TJ, Edwards KL, Zabetian CP. Large-scale exploratory genetic analysis of cognitive impairment in Parkinson’s disease. Neurobiol Aging 56:211.e1-.e7, 2017; PMCID: PMC5536182.

20)       Beecham GW, Hamilton K, Naj AC, Martin ER, Huentelman M, Myers AJ, Corneveaux JJ, Hardy J, Vonsattel JP, Younkin SG, Bennett DA, De Jager PL, Larson EB, Crane PK, Kamboh MI, Kofler JK, Mash DC, Duque L, Gilbert JR, Gwirtsman H, Buxbaum JD, Kramer P, Dickson DW, Farrer LA, Frosch MP, Ghetti B, Haines JL, Hyman BT, Kukull WA, Mayeux RP, Pericak-Vance MA, Schneider JA, Trojanowski JQ, Reiman EM, Alzheimer’s Disease Genetics C, Schellenberg GD, Montine TJ. Genome-wide association meta-analysis of neuropathologic features of Alzheimer’s disease and related dementias. PLoS Genet 10(9):e1004606, 2014; PMCID: PMC4154667.

21)       Beecham GW, Dickson DW, Scott WK, Martin ER, Schellenberg G, Nuytemans K, Larson EB, Buxbaum JD, Trojanowski JQ, Van Deerlin VM, Hurtig HI, Mash DC, Beach TG, Troncoso JC, Pletnikova O, Frosch MP, Ghetti B, Foroud TM, Honig LS, Marder K, Vonsattel JP, Goldman SM, Vinters HV, Ross OA, Wszolek ZK, Wang L, Dykxhoorn DM, Pericak-Vance MA, Montine TJ, Leverenz JB, Dawson TM, Vance JM. PARK10 is a major locus for sporadic neuropathologically confirmed Parkinson disease. Neurology 84(10):972-80, 2015; PMCID: PMC4352096.

22)       Chahine LM, Qiang J, Ashbridge E, Minger J, Yearout D, Horn S, Colcher A, Hurtig HI, Lee VM, Van Deerlin VM, Leverenz JB, Siderowf AD, Trojanowski JQ, Zabetian CP, Chen-Plotkin A. Clinical and biochemical differences in patients having Parkinson disease with vs without GBA mutations. JAMA neurology 70(7):852-8, 2013; PMCID: PMC3762458.

23)       Kalia LV, Lang AE, Hazrati LN, Fujioka S, Wszolek ZK, Dickson DW, Ross OA, Van Deerlin VM, Trojanowski JQ, Hurtig HI, Alcalay RN, Marder KS, Clark LN, Gaig C, Tolosa E, Ruiz-Martinez J, Marti-Masso JF, Ferrer I, Lopez de Munain A, Goldman SM, Schule B, Langston JW, Aasly JO, Giordana MT, Bonifati V, Puschmann A, Canesi M, Pezzoli G, Maues De Paula A, Hasegawa K, Duyckaerts C, Brice A, Stoessl AJ, Marras C. Clinical correlations with Lewy body pathology in LRRK2-related Parkinson disease. JAMA neurology 72(1):100-5, 2015; PMCID: PMC4399368.

24)       Lill CM, Rengmark A, Pihlstrom L, Fogh I, Shatunov A, Sleiman PM, Wang LS, Liu T, Lassen CF, Meissner E, Alexopoulos P, Calvo A, Chio A, Dizdar N, Faltraco F, Forsgren L, Kirchheiner J, Kurz A, Larsen JP, Liebsch M, Linder J, Morrison KE, Nissbrandt H, Otto M, Pahnke J, Partch A, Restagno G, Rujescu D, Schnack C, Shaw CE, Shaw PJ, Tumani H, Tysnes OB, Valladares O, Silani V, van den Berg LH, van Rheenen W, Veldink JH, Lindenberger U, Steinhagen-Thiessen E, Consortium S, Teipel S, Perneczky R, Hakonarson H, Hampel H, von Arnim CA, Olsen JH, Van Deerlin VM, Al-Chalabi A, Toft M, Ritz B, Bertram L. The role of TREM2 R47H as a risk factor for Alzheimer’s disease, frontotemporal lobar degeneration, amyotrophic lateral sclerosis, and Parkinson’s disease. Alzheimers Dement;10.1016/j.jalz.2014.12.009, 2015.

25)       Mata IF, Checkoway H, Hutter CM, Samii A, Roberts JW, Kim HM, Agarwal P, Alvarez V, Ribacoba R, Pastor P, Lorenzo-Betancor O, Infante J, Sierra M, Gomez-Garre P, Mir P, Ritz B, Rhodes SL, Colcher A, Van Deerlin V, Chung KA, Quinn JF, Yearout D, Martinez E, Farin FM, Wan JY, Edwards KL, Zabetian CP. Common variation in the LRRK2 gene is a risk factor for Parkinson’s disease. Mov Disord 27(14):1822-5, 2012; PMCID: PMC3536918.

26)       Nalls MA, McLean CY, Rick J, Eberly S, Hutten SJ, Gwinn K, Sutherland M, Martinez M, Heutink P, Williams NM, Hardy J, Gasser T, Brice A, Price TR, Nicolas A, Keller MF, Molony C, Gibbs JR, Chen-Plotkin A, Suh E, Letson C, Fiandaca MS, Mapstone M, Federoff HJ, Noyce AJ, Morris H, Van Deerlin VM, Weintraub D, Zabetian C, Hernandez DG, Lesage S, Mullins M, Conley ED, Northover CA, Frasier M, Marek K, Day-Williams AG, Stone DJ, Ioannidis JP, Singleton AB. Diagnosis of Parkinson’s disease on the basis of clinical and genetic classification: a population-based modelling study. Lancet Neurol 14(10):1002-9, 2015; PMCID: PMC4575273.

27)       Nalls MA, Duran R, Lopez G, Kurzawa-Akanbi M, McKeith IG, Chinnery PF, Morris CM, Theuns J, Crosiers D, Cras P, Engelborghs S, De Deyn PP, Van Broeckhoven C, Mann DM, Snowden J, Pickering-Brown S, Halliwell N, Davidson Y, Gibbons L, Harris J, Sheerin UM, Bras J, Hardy J, Clark L, Marder K, Honig LS, Berg D, Maetzler W, Brockmann K, Gasser T, Novellino F, Quattrone A, Annesi G, De Marco EV, Rogaeva E, Masellis M, Black SE, Bilbao JM, Foroud T, Ghetti B, Nichols WC, Pankratz N, Halliday G, Lesage S, Klebe S, Durr A, Duyckaerts C, Brice A, Giasson BI, Trojanowski JQ, Hurtig HI, Tayebi N, Landazabal C, Knight MA, Keller M, Singleton AB, Wolfsberg TG, Sidransky E. A multicenter study of glucocerebrosidase mutations in dementia with Lewy bodies. JAMA neurology 70(6):727-35, 2013; PMCID: PMC3841974.

28)       Nuytemans K, Inchausti V, Beecham GW, Wang L, Dickson DW, Trojanowski JQ, Lee VM, Mash DC, Frosch MP, Foroud TM, Honig LS, Montine TJ, Dawson TM, Martin ER, Scott WK, Vance JM. Absence of C9ORF72 expanded or intermediate repeats in autopsy-confirmed Parkinson’s disease. Mov Disord 29(6):827-30, 2014; PMCID: PMC4022044.

29)       Pankratz N, Beecham GW, DeStefano AL, Dawson TM, Doheny KF, Factor SA, Hamza TH, Hung AY, Hyman BT, Ivinson AJ, Krainc D, Latourelle JC, Clark LN, Marder K, Martin ER, Mayeux R, Ross OA, Scherzer CR, Simon DK, Tanner C, Vance JM, Wszolek ZK, Zabetian CP, Myers RH, Payami H, Scott WK, Foroud T. Meta-analysis of Parkinson’s disease: identification of a novel locus, RIT2. Ann Neurol 71(3):370-84, 2012; PMCID: PMC3354734.

30)       Tsuang D, Leverenz JB, Lopez OL, Hamilton RL, Bennett DA, Schneider JA, Buchman AS, Larson EB, Crane PK, Kaye JA, Kramer P, Woltjer R, Kukull W, Nelson PT, Jicha GA, Neltner JH, Galasko D, Masliah E, Trojanowski JQ, Schellenberg GD, Yearout D, Huston H, Fritts-Penniman A, Mata IF, Wan JY, Edwards KL, Montine TJ, Zabetian CP. GBA mutations increase risk for Lewy body disease with and without Alzheimer disease pathology. Neurology 79(19):1944-50, 2012; PMCID: PMC3484986.

31)       Tsuang D, Leverenz JB, Lopez OL, Hamilton RL, Bennett DA, Schneider JA, Buchman AS, Larson EB, Crane PK, Kaye JA, Kramer P, Woltjer R, Trojanowski JQ, Weintraub D, Chen-Plotkin AS, Irwin DJ, Rick J, Schellenberg GD, Watson GS, Kukull W, Nelson PT, Jicha GA, Neltner JH, Galasko D, Masliah E, Quinn JF, Chung KA, Yearout D, Mata IF, Wan JY, Edwards KL, Montine TJ, Zabetian CP. APOE epsilon4 increases risk for dementia in pure synucleinopathies. JAMA neurology 70(2):223-8, 2013; PMCID: PMC3580799.

32)       Kun-Rodrigues C, Ross OA, Orme T, Shepherd C, Parkkinen L, Darwent L, Hernandez D, Ansorge O, Clark LN, Honig LS, Marder K, Lemstra A, Scheltens P, van der Flier W, Louwersheimer E, Holstege H, Rogaeva E, St George-Hyslop P, Londos E, Zetterberg H, Barber I, Braae A, Brown K, Morgan K, Maetzler W, Berg D, Troakes C, Al-Sarraj S, Lashley T, Holton J, Compta Y, Van Deerlin V, Trojanowski JQ, Serrano GE, Beach TG, Clarimon J, Lleo A, Morenas-Rodriguez E, Lesage S, Galasko D, Masliah E, Santana I, Diez M, Pastor P, Tienari PJ, Myllykangas L, Oinas M, Revesz T, Lees A, Boeve BF, Petersen RC, Ferman TJ, Escott-Price V, Graff-Radford N, Cairns NJ, Morris JC, Stone DJ, Pickering-Brown S, Mann D, Dickson DW, Halliday GM, Singleton A, Guerreiro R, Bras J. Analysis of C9orf72 repeat expansions in a large international cohort of dementia with Lewy bodies. Neurobiol Aging;10.1016/j.neurobiolaging.2016.08.023, 2016.

33)       Wang LS, Naj AC, Graham RR, Crane PK, Kunkle BW, Cruchaga C, Murcia JD, Cannon-Albright L, Baldwin CT, Zetterberg H, Blennow K, Kukull WA, Faber KM, Schupf N, Norton MC, Tschanz JT, Munger RG, Corcoran CD, Rogaeva E, Alzheimer’s Disease Genetics C, Lin CF, Dombroski BA, Cantwell LB, Partch A, Valladares O, Hakonarson H, St George-Hyslop P, Green RC, Goate AM, Foroud TM, Carney RM, Larson EB, Behrens TW, Kauwe JS, Haines JL, Farrer LA, Pericak-Vance MA, Mayeux R, Schellenberg GD, National Institute on Aging-Late-Onset Alzheimer’s Disease Family S, Albert MS, Albin RL, Apostolova LG, Arnold SE, Barber R, Barmada M, Barnes LL, Beach TG, Becker JT, Beecham GW, Beekly D, Bennett DA, Bigio EH, Bird TD, Blacker D, Boeve BF, Bowen JD, Boxer A, Burke JR, Buxbaum JD, Cairns NJ, Cao C, Carlson CS, Carroll SL, Chui HC, Clark DG, Cribbs DH, Crocco EA, DeCarli C, DeKosky ST, Demirci FY, Dick M, Dickson DW, Duara R, Ertekin-Taner N, Fallon KB, Farlow MR, Ferris S, Frosch MP, Galasko DR, Ganguli M, Gearing M, Geschwind DH, Ghetti B, Gilbert JR, Glass JD, Graff-Radford NR, Growdon JH, Hamilton RL, Hamilton-Nelson KL, Harrell LE, Head E, Honig LS, Hulette CM, Hyman BT, Jarvik GP, Jicha GA, Jin LW, Jun G, Jun G, Kamboh MI, Karydas A, Kaye JA, Kim R, Koo EH, Kowall NW, Kramer JH, LaFerla FM, Lah JJ, Leverenz JB, Levey AI, Li G, Lieberman AP, Lopez OL, Lunetta KL, Lyketsos CG, Mack WJ, Marson DC, Martin ER, Martiniuk F, Mash DC, Masliah E, McCormick WC, McCurry SM, McDavid AN, McKee AC, Mesulam WM, Miller BL, Miller CA, Miller JW, Montine TJ, Morris JC, Murrell JR, Olichney JM, Parisi JE, Perry W, Peskind E, Petersen RC, Pierce A, Poon WW, Potter H, Quinn JF, Raj A, Raskind M, Reiman EM, Reisberg B, Reitz C, Ringman JM, Roberson ED, Rosen HJ, Rosenberg RN, Sano M, Saykin AJ, Schneider JA, Schneider LS, Seeley WW, Smith AG, Sonnen JA, Spina S, Stern RA, Tanzi RE, Thornton-Wells TA, Trojanowski JQ, Troncoso JC, Tsuang DW, Van Deerlin VM, Van Eldik LJ, Vardarajan BN, Vinters HV, Vonsattel JP, Weintraub S, Welsh-Bohmer KA, Williamson J, Wishnek S, Woltjer RL, Wright CB, Younkin SG, Yu CE, Yu L. Rarity of the Alzheimer disease-protective APP A673T variant in the United States. JAMA neurology 72(2):209-16, 2015; PMCID: PMC4324097.

34)       McMillan CT, Toledo JB, Avants BB, Cook PA, Wood EM, Suh E, Irwin DJ, Powers J, Olm C, Elman L, McCluskey L, Schellenberg GD, Lee VM, Trojanowski JQ, Van Deerlin VM, Grossman M. Genetic and neuroanatomic associations in sporadic frontotemporal lobar degeneration. Neurobiol Aging 35(6):1473-82, 2014; PMCID: PMC3961542.

35)       Kang JH, Irwin DJ, Chen-Plotkin AS, Siderowf A, Caspell C, Coffey CS, Waligorska T, Taylor P, Pan S, Frasier M, Marek K, Kieburtz K, Jennings D, Simuni T, Tanner CM, Singleton A, Toga AW, Chowdhury S, Mollenhauer B, Trojanowski JQ, Shaw LM, Parkinson’s Progression Markers I. Association of cerebrospinal fluid beta-amyloid 1-42, T-tau, P-tau181, and alpha-synuclein levels with clinical features of drug-naive patients with early Parkinson disease. JAMA neurology 70(10):1277-87, 2013; PMCID: PMC4034348.

36)       Kang JH, Mollenhauer B, Coffey CS, Toledo JB, Weintraub D, Galasko DR, Irwin DJ, Van Deerlin V, Chen-Plotkin AS, Caspell-Garcia C, Waligorska T, Taylor P, Shah N, Pan S, Zero P, Frasier M, Marek K, Kieburtz K, Jennings D, Tanner CM, Simuni T, Singleton A, Toga AW, Chowdhury S, Trojanowski JQ, Shaw LM, Parkinson’s Progression Marker I. CSF biomarkers associated with disease heterogeneity in early Parkinson’s disease: the Parkinson’s Progression Markers Initiative study. Acta Neuropathol 131(6):935-49, 2016.

37)       Lim NS, Swanson CR, Cherng HR, Unger TL, Xie SX, Weintraub D, Marek K, Stern MB, Siderowf A, Investigators P, Alzheimer’s Disease Neuroimaging I, Trojanowski JQ, Chen-Plotkin AS. Plasma EGF and cognitive decline in Parkinson’s disease and Alzheimer’s disease. Annals of clinical and translational neurology 3(5):346-55, 2016; PMCID: PMC4863747.

38)       Swanson CR, Li K, Unger TL, Gallagher MD, Van Deerlin VM, Agarwal P, Leverenz J, Roberts J, Samii A, Gross RG, Hurtig H, Rick J, Weintraub D, Trojanowski JQ, Zabetian C, Chen-Plotkin AS. Lower plasma apolipoprotein A1 levels are found in Parkinson’s disease and associate with apolipoprotein A1 genotype. Mov Disord 30(6):805-12, 2015; PMCID: PMC4362847.

39)       Toledo JB, Brettschneider J, Grossman M, Arnold SE, Hu WT, Xie SX, Lee VM, Shaw LM, Trojanowski JQ. CSF biomarkers cutoffs: the importance of coincident neuropathological diseases. Acta Neuropathol 124(1):23-35, 2012; PMCID: PMC3551449.

40)       Toledo JB, Korff A, Shaw LM, Trojanowski JQ, Zhang J. CSF alpha-synuclein improves diagnostic and prognostic performance of CSF tau and Abeta in Alzheimer’s disease. Acta Neuropathol 126(5):683-97, 2013; PMCID: PMC3812407.

41)       Swanson CR, Berlyand Y, Xie SX, Alcalay RN, Chahine LM, Chen-Plotkin AS. Plasma apolipoprotein A1 associates with age at onset and motor severity in early Parkinson’s disease patients. Mov Disord 30(12):1648-56, 2015; PMCID: PMC4609229.

42)       Portelius E, Olsson B, Hoglund K, Cullen NC, Kvartsberg H, Andreasson U, Zetterberg H, Sandelius A, Shaw LM, Lee VMY, Irwin DJ, Grossman M, Weintraub D, Chen-Plotkin A, Wolk DA, McCluskey L, Elman L, McBride J, Toledo JB, Trojanowski JQ, Blennow K. Cerebrospinal fluid neurogranin concentration in neurodegeneration: relation to clinical phenotypes and neuropathology. Acta Neuropathol;10.1007/s00401-018-1851-x, 2018.

43)       O’Bryant SE, Gupta V, Henriksen K, Edwards M, Jeromin A, Lista S, Bazenet C, Soares H, Lovestone S, Hampel H, Montine T, Blennow K, Foroud T, Carrillo M, Graff-Radford N, Laske C, Breteler M, Shaw L, Trojanowski JQ, Schupf N, Rissman RA, Fagan AM, Oberoi P, Umek R, Weiner MW, Grammas P, Posner H, Martins R, Star B, groups Bw. Guidelines for the standardization of preanalytic variables for blood-based biomarker studies in Alzheimer’s disease research. Alzheimers Dement 11(5):549-60, 2015; PMCID: PMC4414664.

44)       Lewczuk P, Riederer P, O’Bryant SE, Verbeek MM, Dubois B, Visser PJ, Jellinger KA, Engelborghs S, Ramirez A, Parnetti L, Jack CR, Jr., Teunissen CE, Hampel H, Lleo A, Jessen F, Glodzik L, de Leon MJ, Fagan AM, Molinuevo JL, Jansen WJ, Winblad B, Shaw LM, Andreasson U, Otto M, Mollenhauer B, Wiltfang J, Turner MR, Zerr I, Handels R, Thompson AG, Johansson G, Ermann N, Trojanowski JQ, Karaca I, Wagner H, Oeckl P, van Waalwijk van Doorn L, Bjerke M, Kapogiannis D, Kuiperij HB, Farotti L, Li Y, Gordon BA, Epelbaum S, Vos SJB, Klijn CJM, Van Nostrand WE, Minguillon C, Schmitz M, Gallo C, Lopez Mato A, Thibaut F, Lista S, Alcolea D, Zetterberg H, Blennow K, Kornhuber J. Cerebrospinal fluid and blood biomarkers for neurodegenerative dementias: An update of the Consensus of the Task Force on Biological Markers in Psychiatry of the World Federation of Societies of Biological Psychiatry. World J Biol Psychiatry 19(4):244-328, 2018; PMCID: PMC5916324.

45)       Henriksen K, O’Bryant SE, Hampel H, Trojanowski JQ, Montine TJ, Jeromin A, Blennow K, Lonneborg A, Wyss-Coray T, Soares H, Bazenet C, Sjogren M, Hu W, Lovestone S, Karsdal MA, Weiner MW, Blood-Based Biomarker Interest G. The future of blood-based biomarkers for Alzheimer’s disease. Alzheimers Dement 10(1):115-31, 2014; PMCID: PMC4128378.

46)       Mattsson N, Andreasson U, Persson S, Carrillo MC, Collins S, Chalbot S, Cutler N, Dufour-Rainfray D, Fagan AM, Heegaard NH, Robin Hsiung GY, Hyman B, Iqbal K, Kaeser SA, Lachno DR, Lleo A, Lewczuk P, Molinuevo JL, Parchi P, Regeniter A, Rissman RA, Rosenmann H, Sancesario G, Schroder J, Shaw LM, Teunissen CE, Trojanowski JQ, Vanderstichele H, Vandijck M, Verbeek MM, Zetterberg H, Blennow K. CSF biomarker variability in the Alzheimer’s Association quality control program. Alzheimers Dement 9(3):251-61, 2013; PMCID: PMC3707386.

47)       Toledo JB, Shaw LM, Trojanowski JQ. Plasma amyloid beta measurements – a desired but elusive Alzheimer’s disease biomarker. Alzheimer’s research & therapy 5(2):8, 2013; PMCID: PMC3706955.

48)       Toledo JB, Korff A, Shaw LM, Trojanowski JQ, Zhang J. Low levels of cerebrospinal fluid complement 3 and factor H predict faster cognitive decline in mild cognitive impairment. Alzheimer’s research & therapy 6(3):36, 2014; PMCID: Pmc4255518.

49)       McMillan CT, Avants B, Irwin DJ, Toledo JB, Wolk DA, Van Deerlin VM, Shaw LM, Trojanoswki JQ, Grossman M. Can MRI screen for CSF biomarkers in neurodegenerative disease? Neurology 80(2):132-8, 2013; PMCID: PMC3589187.

50)       Lleo A, Irwin DJ, Illan-Gala I, McMillan CT, Wolk DA, Lee EB, Van Deerlin VM, Shaw LM, Trojanowski JQ, Grossman M. A 2-Step Cerebrospinal Algorithm for the Selection of Frontotemporal Lobar Degeneration Subtypes. JAMA neurology 75(6):738-45, 2018; PMCID: PMC5885205.

51)       Spotorno N, McMillan CT, Irwin DJ, Clark R, Lee EB, Trojanowski JQ, Weintraub D, Grossman M. Decision-Making Deficits Associated with Amyloidosis in Lewy Body Disorders. Front Hum Neurosci 10:693, 2016; PMCID: PMC5225123.

52)       Grossman M, Elman L, McCluskey L, McMillan CT, Boller A, Powers J, Rascovsky K, Hu W, Shaw L, Irwin DJ, Lee VM, Trojanowski JQ. Phosphorylated tau as a candidate biomarker for amyotrophic lateral sclerosis. JAMA neurology 71(4):442-8, 2014; PMCID: PMC3989393.

Please refer to the following manuscripts for comparison with ADNI data files:
CUT POINTS
  • Completion and upload to LONI the Methods Report, “ADNI3: Batch analyses of Ab42, t-tau, and p-tau181 in ADNI1, GO, 2 CSF samples using the fully automated Roche Elecsys and cobas e immunoassay analyzer system”.  This dataset, uploaded April 2017,  includes a total of 2,401 never-before-thawed aliquots of ADNI1, GO and 2 CSF samples that had been collected between 9/7/2005 and 7/25/2016.  See PPT set #101 for a description of major parts of the method validation for Ab42, and some cut-point estimations and see PPT set # 102 for further analyses, determinations of cut-points and relationships of “abnormal” and “normal” biomarker results to cognitive decline and progression from MCI to AD dementia done so far and working toward:
    • definition of cut-points for Ab1-42, t-tau, p-tau181 and the ratios, Ab1-42/t-tau and Ab1-42/p-tau181 using Mixture Modeling and ROC analyses;
    • an understanding of the predictive performance for cognitive decline and progression of MCI participants to a clinical diagnosis of AD dementia using these cut-points;
  • Assessments of the comparisons between Ab-|tau-, Ab-|tau+, Ab+|tau-, and Ab+|tau+ for predictive performance of each pair [Ab+ is below CSF cut-point value; Ab- is at or above CSF cut-point value; tau- is below and tau+ is at or above the cut-point value for CSF tau; analogous pairs for Ab and p-tau181] for cognitive, memory and functional decline and progression from MCI to a clinical diagnosis of AD.
    • assessments of concordance between CSF Ab1-42, t-tau, p-tau181, the ratios, Ab1-42/t-tau and Ab1-42/p-tau181 and Florbetapir PET imaging-based plaque burden assessments.
    • The inclusion of validated CSF Ab40 to Ab1-42, t-tau, and p-tau181 in ADNI3 will permit evaluation of the Ab1-42/Ab40 ratio for possible improvement over Ab1-42 alone for clinical utility.

 A manuscript describing the concordance performance of ADNIGO/2 Roche Elecsys CSF Ab42, t-tau and p-tau181 biomarker data and that from the Swedish BioFINDER study with either Florbetapir PET or Flutemetamol amyloid PET imaging, respectively, in the respective study cohorts, has been accepted for publication (Hansson et al, 2018b).

Provided support for the development of new immunoassays for CSF Ab42, t-tau, p-tau181 by providing residual CSF aliquot samples to 3 vendor laboratories.

Figure 2. Timing for the onset and progression of AD

The figure below illustrates the timing for the onset and progression of the AD in the upper right panel with examples of mixed pathologies found in AD brains in the upper left panel while the lower panel summarizes the timing of pathology deposition and neuron death as well as current considerations for the treatment of AD. This figure is from a recently published update of earlier ADNI reviews from Kang et al, 2015, that provides our current understanding of the hypothetical timeline for the onset and progression of Alzheimer’s Disease neurodegeneration and cognitive impairments progressing from normal to mild cognitive impairment and then to Alzheimer’s disease dementia.

STANDARDIZATION
Leslie M Shaw and John Q Trojanowski
Standardization of measurement methods for AD biomarkers in biofluids:
CSF
  • Analyses of CSF for A?1-42, t-tau and p-tau181 moved from the Research-Use-Only Fujirebio AlzBio3 xMAP bead-based immunoassay to the fully automated Roche Elecsys® platform following extensive validation studies (Bittner, 2016; Shaw, 2016) and for A?42, comparisons with validated reference method LC/MSMS using the primary reference standard preparation of A?42, provided by the Institute for Reference Materials and Measurements (IRMM) following finalization of replicate amino acid analyses(Korecka, 2014; Shaw, 2016; Kuhlman, 2017).  This transition to the fully automated Elecsys® platform supports an important aim for the ADNI Biomarker Core in the ADNI3 grant renewal namely to support the implementation of AD biomarkers in future clinical trials making use of a highly validated methodology with robust, reproducible cross-laboratory performance standardization that will enable effective implementation of universal cut-point values (Hansson, 2018; Schindler, 2018).  Starting with the CSF samples collected from ADNI3 participants A?1-40 will be added to A?1-42, t-tau and p-tau181 in order to provide measurement of the A?1-42/A?1-40 ratio in each ADNI3 CSF sample.  In addition, the Biomarker core provided Roche Elecsys-based A?1-42, A?1-40, t-tau and p-tau181 measurements in all DIAN participant CSF samples as part of a collaborative study between DIAN and ADNI.  A subset of ADNIGO/2 CSF samples were also analyzed as part of this study and results are summarized in a Methods report posted April, 2018.
  • Implementation of a fully validated reference LC/MSMS method for CSF A?42 and further validated for CSF A?40 and A?38 (see Korecka, 2014, Panee, 2016; Kuhlman, 2016) for measurements in all ADNIGO/2 BASELINE and LONGITUDINAL CSF samples over a total of 70 analytical runs. The Methods document and dataset for these analyses were uploaded to the LONI ADNI website, June, 2018.  The methods document includes frequency plots for each analyte and for the A?42/A?40 ratio and makes use of cut-points based on ROC analysis wherein FBP PET served as the AD biomarker, and documents major analytical factors including precision performance and experience and included one change in the lot of calibration standards (Korecka, 2018).
  • Important NOTE: The preparation of Certified Reference Material for CSF A?1-42 was completed late 2017 (Kuhlmann, 2017, Certification report). A number of immunoassay vendors are collaborating pre-competitively on the use of this material for adjusting their calibrators based on the three prepared human CSF pools whose A?1-42 concentrations were established by participating reference laboratories each using validated LC/MSMS methods including two JCTLM-listed reference methods (Korecka, 2014; Leinenbach, 2014).  The purpose of this effort is to achieve harmonization across the different immunoassay platforms.  In concert with this effort the ADNI Biomarker Core laboratory will make use of the three CRMs to adjust all ADNI GO/2 CSFs that were measured by a reference UPLC/MSMS method (Korecka, 2014) and we plan to collaborate with Roche on adjustment of all ADNI CSF A?1-42 values based on the CRMs and this will assure that ADNI CSF A?1-42 data are based on this common CRM-based standardization process.
A?1-40
  • Recently a number of studies (Lewczuk,2017; Janeldze S, 2016; 2017; Niemantsverdriet, 2017) have reported that compared to CSF A?1-42 alone, the CSF A?1-42/A?1-40 ratio might improve:
  1. The prediction accuracy of Alzheimer’s disease (AD) in MCI study participants
  2. Discrimination of AD from other forms of dementia
  3. Concordance between CSF and PET amyloidosis

The statistical analyses of this ADNI dataset as reported in the Methods document focused on confirming the improved detection of amyloid pathology when using the CSF A?1-42/A?1-40 ratio vs CSF A?1-42 alone based on improved concordance between the A?1-42/A?1-40 ratio and FBP amyloid PET compared to CSF A?1-42 alone.  A secondary focus of the statistical analyses was assessment of the diagnostic utility of A?1-42/A?1-38 ratio.  An improved concordance from 83% to 89% was observed for the A?1-42/A?1-40 ratio as described in the Methods document.  Similar degree of improvement was observed for the A?1-42/A?1-38 ratio.  Further studies are required to determine the potential added value of A?1-38.

Given the heightened interest in and growing number of studies showing the improved utility of the A?1-42/A?1-40 ratio, an effort is planned to prepare CRMs for A?1-40 analogous to what was done for A?1-42 and we will participate in this effort as well.  In the ADNI3 phase we are adding A?1-40 to A?1-42, t-tau and p-tau181 measurements using the Roche Elecsys® platform in CSFs collected in ADNI3.

Pre-analytical factors:
  • Another key element of overall standardization of CSF AD biomarker measurements is recognition and control of pre-analytical factors including (1) timing of CSF sampling; (2) location of sampling and volume of CSF; (3) type of puncture needle; (4) collection method (gravity drip or syringe pull); (5) blood contamination; (6) type of plastic CSF comes into contact with; (7) the number of transfer steps; (8) additives; (9) shaking/mixing; (10) heat; (11) centrifugation; (12) storage temperature; (13) the # of freeze/thaw cycles; (14) storage time at -80 0 These factors were considered in a recent review and recommendations for future study were made including a proposed collaborative study that includes a unified CSF collection protocol (Hansson, 2018).  Many investigators have contributed to these studies of pre-analytical factors and all are acknowledged in Hansson, 2018 and will not be tabulated here due to the need for conservation of space.  In the ADNI study the recommended time for LP, (as well as blood draws for serum and plasma collections), is in the morning following an overnight fast; for LPs, based on improved patient safety, the use of a blunt tipped atraumatic Sprotte needle is recommended-22 g and gravity drip, although 24 g Sprotte and syringe pull without use of plastic catheter tubing is permitted and favored by a number of experienced ADNI clinical sites.  Since tube transfer has been shown to reduce CSF A?1-42 concentration, keeping this to a minimum in the preparation of aliquots is recommended.  In the ADNI study this factor is reduced to a minimum for both gravity drip and syringe pull as described in the ADNI3 Biomarker Sample Collection, Processing and Shipmenten documnet .When CSF aliquots are prepared in the Biomarker core laboratory, an additional transfer step is undertaken in order to permit mixing of the two tubes of CSF and eliminate any possible gradient effects.   All ADNI CSF samples undergo one thaw-freeze cycle in the preparation of 0.5 mL aliquots in the Biomarker core laboratory, thus one additional freeze-thaw cycle.  Available study data suggests that up to 2 freeze-thaw cycles will not result in diminished CSF A?1-42 concentration (Lewczuk, 2017). Further description of the time dynamics for CSF is available in the “BIOFLUID BANKING” section.
Plasma
  • There is increased interest in the development and validation of plasma-based biomarkers for at least as a screening test to detect AD pathology. Recent studies show promise that new approaches to measurements of A?1-42 and A?1-40 can detect AD with AUC values approaching 0.9 (Ovod, 2017; Nakamura, 2018) when amyloid PET is used as the standard of comparison, whereas in the past results across 26 studies using then-available immunoassays were not consistent for reliable detection of AD (Rissman, 2012).  New and improved mass spectrometry based methods (Ovod, 2017; Nakamura, 2018) and immunoassays (Song, 2018) are now being further evaluated with the promise that one or more of these will prove to be rugged and reliable for use as screening tests in the context of treatment trials as well as in the clinic.  Essential to progress in development of rugged and reliable AD biomarkers in plasma is recognition and control of pre-analytical factors that affect the concentration measurements.
  • A proposed set of guidelines for the standardization of pre-analytic variables was recently published (O’Bryant et al, 2015). A review of plasma and serum processing experience in the ADNI study is available in the “Biofluid Banking” section.
  • With the acceleration of studies and assessments of various platforms and biomarker analytes a key need is for determinations and definitions for best practice pre-analytical procedures including sample processing time and temperature, number of freeze-thaw cycles, plastic tube type, volume of sample aliquot in relationship to tube volume, sample stability at different temperatures, the need to check for and identification of other factors such as the presence of HAMA(human anti-mouse antibodies) that are well known to cause interference in various immunoassays in routine laboratory testing(Sturgeon, 2018), and hemoglobin.
  • A recently published study (Keshavan, 2018) described the effect of repeated freeze-thaw cycles on plasma A?1-42, A?1-40, t-tau and serum NFL using the Quanterix high sensitivity platform. Up to four freeze-thaw cycles did not influence concentrations of these biomarkers to a significant degree with at most minor reductions in A?40 after the 4th The authors recommended that for measurements that include A?40 be limited to no more than 2 freeze-thaw cycles.  In our view this study suggests that careful documentation of the effect of freeze-thaw is needed for each analytical methodology as these investigators have done for the Simoa (Quanterix) platform.
  • Round robin studies will be an essential step for determination of the comparative utilities and robustness of these new biomarker tests and we look forward to participation in these.
  • The Alzheimer’s Association Global Biomarkers Standardization Consortium (GBSC) is actively considering addition of blood based biomarkers to the CSF QC program that is being run by Kaj Blennow and colleagues in Gothenburg Sweden.
REFERENCES

Bittner T, Zetterberg H, Teunissen CE, Ostlund RE, Jr., Militello M, Andreasson U et al (2016) Technical performance of a novel, fully automated electrochemiluminescence immunoassay for the quantitation of beta-amyloid (1-42) in human cerebrospinal fluid. Alzheimers Dement 12:517–526.  PMID: 26555316

Shaw LM, Fields L, Korecka M, Waligorksa T, Trojanowski JQ, Allegranza D, et al. Method comparison of A?(1-42) measured in human cerebrospinal fluid samples by liquid chromatography-tandem mass spectrometry, the INNO-BIA AlzBio3 assay, and the Elecsys® ?-Amyloid(1-42) assay. Alzheimers Dement 2016;12:668.

Korecka M, Waligorska T, Figurski M, Toledo JB, Arnold SE, Grossman M, Trojanowski JQ, Shaw LM. Qualification of a surrogate matrix-based absolute quantification method for amyloid-??? in human cerebrospinal fluid using 2D UPLC-tandem mass spectrometry. Journal of Alzheimer’s disease: JAD. 2014;41(2):441-51. PMID: 24625802. {C12RMP1}

Korecka M, Figurski M, Fields L, Trojanowski JQ, Shaw LM.  2D-UPLC tandem mass spectrometry measurement of A?1-42, A?1-40 and A?1-38 in ADNI2 and ADNIGO CSF.  ADNI Methods document, 6/20/2018.

Leinenbach A, Pannee J, Dulffer T, Huber A, Bittner T, Andreasson U, Gobom J, Zetterberg H, Kobold U, Portelius E, Blennow K. Mass spectrometry-based candidate reference measurement procedure for quantification of amyloid-beta in cerebrospinal fluid. Clin Chem. 2014; 60:987–994. PMID: 24842955. {C11RMP9}

Kuhlmann J, Boulo S, Andreasson U, Bierke M, Pannee J, Charoud-Got J, et al.  The certification of Amyloid ?1-42 in CSF ERM®-DA481/IFCC and ERM®-DA482/IFCC. 2018 Reference Materials Report, JRC 107381.

Kuhlmann J, Andreasson U, Pannee J, Bjerke M, Portelius E, etal.  CSF A?1-42-an excellent but complicated Alzheimer’s biomarker-a route to standardization.  Clin Chim Acta 2017; 467: 27-33.

Hansson O, Seibyl J, Stomrud E, Zetterberg H, Trojanowski JQ, Bittner T, Lifke V, Corradini V, Eichenlaub U, Batrla R, Buck K, Zink K, Rabe C, Blennow K, Shaw LM.  CSF biomarkers of Alzheimer’s disease concord with amyloid-beta PET and predict clinical progression: a study of fully automated immunoassays in BioFINDER and ADNI cohorts. Alzheimers Dement. 2018; https://doi.org/10.1016/j.jalz.2018.01.010 [Epub ahead of print].

Schindler SE, Gray JD, Gordon BA, Xiong C, Bartrla-Uttermann, Quan M, Wahl S, Benzinger TLS, Holtzman DM, Morris JC, Fagan AM.  Cerebrospinal fluid biomarkers measured by Elecsys assays compared to amyloid imaging.  Alzheimers Dement. 2018; in press, https://doi.org/10.1016/j.jalz.2018.01.013

Hansson O, Mikulskis A, Fagan AE, Teunissen C, Zetterberg H, Vanderstichele H, Molinuevo JL, Shaw LM, Vandijck M, Berbeek MM, Savage M, Mattsson N, Lewczuk P, Batrla R, Rutz S, Dean RA, Blennow K.  The impact of preanalytical variables on measureing CSF biomarkers for Alzheimer’s disease diagnosis: a review.  Alzheimer’s Dementia 2018, in press, https://doi.org/10.1016/j.alz.2018.05.008.

Lewczuk P, Matzen A, Blennow K, Parnetti L, Molinuevo JL, Eusebi P, Kornhuber J, Morris JC, Fagan AM. Cerebrospinal fluid Ab42/40 corresponds better than Ab42 to amyloid PET in Alzheimer’s disease. J AlzheimersDis 2017;55:813-822. PMID: 27792012

Janeldze S, Pannee J, Mikulskis A, Chiao P, Zetterberg H, Blennow K, Hansson O. Concordance between different amyloid immunoassays and visual amyloid positron emission tomographic assessment. JAMA Neurol 2017;74:1492-1501. PMID: 29114726

Janeldze S, Zetterberg H, Mattsson N, Palmqvist S, Vanderstichele H, Lindberg O, van Westen D, Stomrud E, Minthon L, Blennow K, for the Swedish BioFINDER study group and Hansson O.  CSF A?42/A?40 and A?42/A?38 ratios: better diagnostic markers of Alzheimer’s disease.  Ann Clin Transl Neurol 2016; 3: 154-165.  PMID: 27042676

Niemantsverdriet E, Ottoy J, Somers C, De Roeck E, Struyfs H, Soetewey F, Verhaeghe J, Van den Bossche T, Van Mossevelde S, Goeman J, De Deyn PP, Mariën P, Versijpt J, Sleegers K, Van Broeckhoven C, Wyffels L, Albert A, Ceyssens S, Stroobants S, Staelens S, Bjerke M, Engelborghs S. The Cerebrospinal Fluid A?1-42/A?1-40 Ratio Improves Concordance with Amyloid-PET for Diagnosing Alzheimer’s Disease in a Clinical Setting. J Alzheimers Dis. 2017;60:561-576.  PMID: 28869470

Lewczuk P, Riederer P, O’Bryant SE, Verbeek MM, Dubois B, Visser PJ, etal.  Cerebrospinal fluid and blood biomarkers for neurodegenerative dementias: an update of the Consensus of the Task Force on Biological Markers in Psychiatry of the World Federation of Societies of Biological Psychiatry.  The World J of Biol Psych 2017; http://dx.doi.org/10.1080/15622975.2017.1375556

Ovod V, Ramsey KN, Mawuenyega KG, Bollinger JG, Hicks T, Schneider T, etal.  Amyloid ?concentrations and stable isotope labeling kinetics of human plasma specific to central nervous system amyloidosis.  Alzheimer’s Dement 2017; 13: 841-849.  PMCID:PMC5567785

Nakamura A, Kaneko N, Villemagne VL, Kato T, Doecke J, Dore V, et al.  High performance plasma amyloid-? biomarkers for Alzheimer’s disease.  Letter. Nature;  http://www.nature.com/doifinder/10.1038/nature25456.

Song L, Lachno DR, Hanlon D, Shepra D, Shepiro A, Jeromin A, Gemani D, Talbot JA, Racke MM, Dage JL, Dean RA.  A digital enzyme-linked immunosorbent assay for ultrasensitive measurement of amyloid-? 1-42 peptide in human plasma with utility for studies of Alzheimer’s disease therapeutics.  Alz Res Ther 2018; 58:soi 10.1186/s 13195-016-0225-7.

Sturgeon C. Tumor Markers, Chapter 31, in: Tietz Textbook of Clinical Chemistry and Molecular Diagnostics, 6th Edition; Rafai N, Horvath AN, Wittwer CT, eds. Elsevier, St Louis, MO, pp 436-478,

Keshavan A, Helsegrave A, Zetterberg H, Schott JM.  Stability of blood-based biomarkers of Alzheimer’s diseae over multiple freeze-thaw cycles.  Alz Dementia: Diag Assessment Dis Monit 2018; in press, https://doi.org/10.1016/j.dadm.2018.06.001

BIOFLUID BANKING
Leslie M Shaw and John Q Trojanowski

The Biomarker Core continues to receive, aliquot, store and curate all biofluid samples (CSF, plasma, serum) collected from subjects enrolled in ADNI3, including all who “carry over” from ADNIGO/2 and all newly enrolled individuals, with 24/7 surveillance in the ADNI freezers (-80 0C) that are housed in secure, dedicated space at UPENN. The updated (as of June 4, 2018) list of pristine aliquots of CSF, plasma and serum samples collected from ADNI subjects, can be found on the ADNI LONI website under BIOSPECIMENS, but below in Table 1 is a brief summary of these samples.

Table 1. Summary of ADNI CSF, plasma and serum samples received and aliquots prepared as of 7/18/2018.

CSF Ser + Pla TOTAL
ADNI 1 Primary Biofluids Collected 1118 9756 10874
ADNI 1 Aliquots in Bank 24934 132581 157515
ADNI GO/2 Primary Biofluids Collected 1318 7816 9134
ADNI GO/ 2 Aliquots in Bank 35315 114919 150234
ADNI 3 Primary Biofluids Collected – Rollover Participants 118 667 785
ADNI 3 Primary Biofluids Collected – New Enrollees 162 402 568
NOTE: Aliquots of ADNI3 fluid samples are in preparation & #’s will be available in next update of this table.  Detailed aliquots report is available in Biospecimen section of “Access Data and Samples” drop down menu.

Biomarker Core staff continue to monitor details involved in the preparation of all Biofluid samples at study sites including time from obtaining each sample to the time of freezing on dry ice (a summary of this is provided in Figure 1 below). We continue to review details involved in the pre-analytical steps involved in biofluid sample collections. In the figure below a focus on sample preparation time shows that for CSF the mean, 95%CI and median values across 1,318 samples collected from ADNIGO/2 phase participants is: 44.8 min, (41.7-47.8 min) and 28 min respectively. For 3,908 plasma samples the respective values are: 71.7 min, (70.0-73.4 min) and 55 min. This information is available for each ADNI sample. The handling at each ADNI site of these biofluid samples is very important to assure the quality of each sample. Avoidance of hemolysis and time-efficient sample preparation are essential to the goal of sample quality. For plasma, the recommended time from collection to freezing is no longer than 120 min; for CSF the recommended time is 60 min or less in order to minimize risk for biomarker degradation due to various metabolic processes.

Figure 1. Sample collection to freezing time for ADNI GO/2 plasma and CSF primary samples

Biomarker Core staff regularly communicate with individual sites and Clinical Core staff regarding biofluid collections and any issues concerning sample quality, labeling discrepancies, and provision of updated samples-received summaries.

We are continuing our collaborative studies on identifying and controlling pre-analytical factors that can contribute to variability in CSF or plasma biomarker measurements especially A?1-42 (Vanderstichele, 2011; O’Bryant, 2015; Hansson, 2018). An example of this is a world-wide collaborative effort under the auspices of the Alz Association Global Biomarker Standardization Consortium(GBSC) whose members from industry and academic centers are defining a unified protocol for CSF sample collection for use in routine clinical practice that does not require freezing of CSF and another for large multicenter studies such as ADNI, wherein freezing bio-fluid samples prepared at 59 study sites and shipment to the Biomarker core laboratory is essential for assurance of sample stability for the long-term.  The latter is also consistent with international treatment trials wherein long-term storage is an essential aspect for biomarker studies in bio-fluids.  A new effort is the Biomarkers Consortium NSC – Plasma A? Working Group that was recently organized to pursue various aspects of plasma A? measurement.  Although there have been mixed results for plasma A?42/A?40 for accurate detection of AD using a number of immunoassay approaches, it is fervently hoped that by identifying and controlling pre-analytical factors, improved analytical techniques, and controlling for concomitant disease factors(Rissman, 2012) that progress can be made on improving the diagnostic utility of these measurements (Ovod, 2017; Nakamura, 2018; Song, 2018). We will provide updates of these developments at the annual ADNI Steering Committee meetings and FTF meetings with our ADNI PPSB colleagues.

RARC-approved studies using ADNI Biofluids

Biomarker Core staff prepare and ship bio-fluid samples(CSF, plasma or serum) to all investigators whose biomarker study proposals have been approved by the RARC (Resource Allocation Review Committee, appointed by the NIA) and following final review by NIA (see Table summarizing ADNI Biofluid Samples Sent to Investigators for RARC-Approved Studies for an up to date brief summary of these studies and status of results upload). Once completed the data from these studies, performed blinded, are uploaded on the LONI/ADNI website together with a Methods document that describes the methodology involved and quality control performance. Biomarker Core faculty, Drs Trojanowski and Shaw are happy to provide input on any study although this is not required but often we are asked. The procedure for making an application to the Resource Allocation Review Board(RARC) for ADNI biofluid aliquot samples is available on the Access Sample page.

A study that builds upon the 2013-2014 proteomic study that used LC/MSMS mrm mass spectrometry methodology will be conducted in 2018 to determine accurate concentration values for 5 candidate biomarkers that showed promise in the earlier semi-quantitative-based study (see Table 2 for a synopsis of all of these studies). An important characteristic of this study is its emphasis on measurements in longitudinal CSF samples across time from entry into the ADNI study (BASELINE) to at least 4 years later in order to assess these biomarker trajectories. Such data can be informative to clinical trials that are seeking to use biomarkers as indices of drug engagement and drug effect.

We continue to collaborate with biomarker scientists at UPenn and elsewhere (Irwin, 2017, 2018; Hu, 2010, 2015; Toledo, 2013, 2018; Mattsson, 2013, 2016; Zetterberg and Blennow, 2016). New CSF biomarker-neuropathology correlations done with UPenn collaborators resulted in studies involving CSF tau and histochemical tau in FTLD and CSF tau and A?42 and synucleinopathy in autopsied Lewy Body disorders (Irwin etal, 2017, 2018). Such studies take advantage of the large set of CSF collected at UPenn from individuals prior to death and for whom an autopsy diagnosis provides accurate detection of not only AD neuropathology but concomitant pathologies such as Lewy Bodies, TDP-43 deposits, hippocampal sclerosis. A list of the publications describing the results of these studies thus far is included in a more detailed discussion in “Alzheimer’s Disease Neuroimaging (ADNI) Related Biofluid and Genetic Biomarker Studies Using non-ADNI UPenn Biosamples Followed Longitudinally.”

Biomarker Consortium Project

Biomarker tools for early diagnosis and disease progression in Alzheimer’s disease (AD) remain key issues in AD drug development. Identification and validation of cost-effective, non-invasive methods to identify early AD and to monitor treatment effects in mild-moderate AD patients could revolutionize current clinical trial practice. Treatment prior to the onset of dementia may also ensure intervention occurs before irreversible neuropathology.

For more information on outlining Proteomic Analysis of ADNI Data, download the study strategies below.

ADNI has funded the following MRI core analysis labs to generate numeric summaries from the high-quality MRI data available in the data archive. Below is a summary of the MRI analysis methods. Anyone with an ADNI Data Archive account may view and download the analysis methods and the analyzed data. After logging in, click “Download” and “Study Data” to see all relevant ADNI documents available for download.

Laboratory of Neuro Imaging, USC

Co-investigator: Paul Thompson

Diffusion Tensor Imaging Summary Statistics of White Matter Regions of Interest
Diffusion tensor imaging (DTI) allows for the study of microstructural properties of white matter tracts. Regional summary measures were calculated from DTI to include measures of diffusion and anisotropy of various fiber tracts within the brain. A standard DTI template, with a corresponding white matter tract atlas, was registered to each individual subject. Registrations were subsequently applied to the segmented atlas. Visual inspection of the images ensured adequate registration. The mean of all voxels from each of the regions of interest from the atlas were obtained from maps of fraction (FA) and mean diffusivity (MD).

Tensor-Based Morphometry Protocol
Tensor Based Morphometry (TBM) is applied to cross-sectional MRI data for local volumetric comparisons between two or more groups of subjects, based on nonlinearly registering individual brain scans to a common anatomical template. Moreover, when TBM is applied to a longitudinal MRI study, the derived Jacobian maps reflect the percentage of tissue change over time.

Center for Imaging of Neurodegenerative Diseases, UCSF

Co-investigator: Norbert Schuff

FreeSurfer Overview and Quality Control
Cortical reconstruction and volumetric segmentation is performed with the FreeSurfer image analysis suite. FreeSurfer analysis was completed using Version 4.3 for ADNI1 cross-sectional data[UCSFFSX], Version 4.4 for ADNI1 longitudinal data[UCSFFSL], and Version 5.1 for ADNI GO and 2 data[UCSFFSX51].

ASL Perfusion Processing Methods
The Center for Imaging of Neurodegenerative Diseases (CIND) processing pipeline for Arterial Spin Label (ASL) imaging, prepares perfusion-weighted images (PWI) and computes a quantitative map of cerebral blood flow (CBF) and a regional analysis.

Hippocampal Voluming Analysis
Semi-automated hippocampal volumetry was carried out using a commercially available high-dimensional brain mapping tool: Medtronic Surgical Navigation Technologies (SNT). This method of hippocampal voluming has a documented reliability of an intraclass coefficient better than .94.

Alzheimer’s Disease Center, UC Davis

Co-investigator: Charles S. DeCarli

Total Cranial Vault Segmentation: Method and Grading Rubric
The quality of the total cranial vault segmentation using DSE T2 weighted MRI brain scans has been verified and individually graded.

4-Tissue Segmentation Methods for ADNI MR Scans
This document describes the 4-Tissue segmentation methods used for ADNI scans to produce segmentations of each image into four tissue types: White Matter, Gray Matter, Cerebrospinal Fluid, and White Matter Hyperintensity.

Institute of Neurology, University College London

Co-investigator: Nick Fox

Brain and Ventricular Boundary Shift Integral
We describe the processing methods in the brain and ventricular boundary shift integral (BSI). The brain and ventricles were first semi-automatically delineated from the T1-weighted MRI scans. The repeat scans were then registered to the baseline scans using 9-degree-of-freedom registration. The intensity inhomogeneity between the baseline and registered repeat scans was corrected using the differential bias correction. Finally, BSI was calculated over the boundaries of the brain and ventricles respectively using the registered and corrected scans.

Biomedical Image Analysis, University of Pennsylvania

Co-investigator: Christos Davatzikos

Spatial Patter of Abnormalities for Recognition of Early AD
The SPARE-AD score was calculated for each individual, using a specific pattern classification method. This score indicates the presence of an AD-like spatial pattern of brain atrophy, if positive, and otherwise if negative.

View More